|
Robert A. J. Gagnon Home
Articles Available Online
Response to Book Reviews
Material for "Two Views"
Material for "Christian Sexuality"
Answers to Emails
College Materials Robert Gagnon.htm
|
The
2016-17 Gagnon Composite Ranking (GCR) of the Top U.S. Colleges
5/30/17 (and
ongoing)
compiled by Robert A. J.
Gagnon, Ph.D.
As has often (and
rightly) been pointed out, the best college or university is the one
that is the best fit for a given prospective student. The school
with the greatest prestige, the biggest endowment, the most
resources, the greatest financial aid, the highest achieving student
body, the highest retention and graduation rates, the faculty with
the most academic awards and publications, the smallest
faculty-to-student ratios, and the alumni with the highest average
salary is not necessarily going to be the best fit for every
student. (Although that may sound tongue-in-cheek, let not my
readers take it as such.)
Lists cannot account
for a number of variables in the equation for determining the right
fit for a given student. Location (especially proximity to one’s
home) may be more important to a student’s needs than various other
assets of high-end colleges. Moreover, any given prospective student
may thrive more in a less academically competitive environment (the
big-fish-in-a-little-pond phenomenon). Increasingly in our culture
there is this factor: A religiously or politically conservative
student may prosper more and experience much less unhealthy stress
and hostility in an academic environment (and student body) more
congenial to his or her own views. (I am speaking as someone who,
though religiously and politically conservative, did not take that
route in my student days.) For that matter, a morally weak student
can be harmed by the sexually loose lifestyle and the one-sided
left-wing tilt (did I say tilt? I meant pell-mell headlong drive) of
the vast majority of colleges and universities today, including the
most highly rated ones.
Many of the best (and
worst) institutions of the country are increasingly bent on
restricting the free speech and free thought of those with more
“traditional” views. Classrooms can become hostile environments and
social life in such institutions lonely, if one cannot connect with
groups that share an ideological (moral, religious, political,
social) affinity. Apart from all this, a potential applicant’s
presumed major or career objective may dispose him or her to a
generally less prestigious institution of higher learning that
happens to be a strong match for his or her set of interests. In
some cases professors who have not published extensively may spend
more time both mentoring students and developing teaching skills
(though there is some correlation between publications and teaching
content). In short, the “optimal learning environment” can vary
greatly from one student to the next.
So even if a “best
colleges” list or lists accurately reflected what were the best
colleges from the standpoint of a limited set of criteria, it would
not necessarily pose a fait accompli for the potential
applicant: “I have to apply to the top schools! I just have to
apply!”
As it is, lists are
far from perfect indicators of what the overall best schools are
(even judged from limited criteria). Lists differ in significant
ways from each other, depending on what elements a given list
stresses. Lists that factor in the opinions of others (college
administrators, alumni, current students) are rampant with
subjectivity (though a school's reputation cannot be discounted in
hiring and grad school admissions).
Some schools have
learned how to manipulate rankings through various means ranging
from outright lying to fudging data (for example, not reporting the
test scores of international students) or altering data through
unscrupulous admissions practices (for example, encouraging large
numbers of students to apply who have little or no hope of being
admitted, as a means to improving the institution’s admissions
selectivity; or wait-listing large numbers of students whom the
admissions office believes will go elsewhere, so as not to damage
yield rates). Critiques of college rankings (particularly
US News) are legion. Go
here,
here,
here,
here,
and
here
for some online examples. Indeed, the compilers of “best colleges”
lists often critique the deficiencies of other lists.
That having been
said, lists of “best colleges” have their benefits (don’t think that
I didn’t give serious consideration to putting my title’s “top
colleges” in quotation marks). For all their differences, there is a
general recognition that some schools typically rise toward the top
because of name recognition, resources, and overall academic
quality. A composite list such as the one provided here can minimize
the biases and idiosyncrasies of any one list. Lists provide a
general consensus, backed up with some hard data, regarding which
schools are more likely to provide quality education.
One can’t visit or
give careful scrutiny to every school. Lists of “best colleges”
(and, I think, especially this composite list) can help students
narrow down their search and perhaps elevate their vision of the
kind of institutions that they might dare to consider. Even though I
came from a low-income family with little post-secondary education
experience (neither of my parents completed a college education), I
found that attending academically high-end schools provided me with
various benefits that I don’t think I would have received had I
attended less challenging institutions (fair disclosure: I have a
B.A. from Dartmouth, a masters from Harvard, and a Ph.D. from
Princeton Theological Seminary which, incidentally, is not part of
Princeton University though they share a historical relationship).
While being a big
fish in a small pond may have its benefits, so too does being in an
academically challenging environment where the overall quality of
professors and fellow students can raise one’s standards of
intellectual inquiry. Increasingly, too, some of the most
prestigious colleges and universities are also becoming the most
inexpensive for students whose parents make less than $100,000 per
year.
I make use of ten
“best colleges” lists, each of which has a particular focus (the
reader may also find helpful the
nicely diagrammed
presentation
of various rankings made by the people at College Choice):
(1) The
US News and
World Report
“Best College Rankings” (2017 [issued Sept. 13, 2016]), the most
widely known ranking and one of the most complex, is distinctive for
the attention it gives to undergraduate “academic reputation,” in
addition to the usual treatment of retention and graduation rates,
faculty resources, student selectivity, and financial resources
(also alumni contributions as a mark of satisfaction). For all its
benefits it does not evaluate the amount of financial aid that a
school gives, nor the average salary of graduates.
(2)
College Choice
(2016) is a simpler list that gives equal attention to the academic
reputation (using
the survey results of US News), financial aid,
the overall cost of a school, and the average starting salary for
graduates. The good people at College Choice provided me with
unpublished material that extended their ranking beyond the top 50
national research universities and the top 50 liberal arts colleges.
(3)
Forbes’
“America’s Top [650] Colleges 2016 Ranking” uses a fairly detailed
set of parameters to assess not “what gets a student into college”
(an implicit slam on US News) but rather “what are students getting out of
college.” They consider various markers that demonstrate student
satisfaction and both academic and post-graduate success, in
addition to student debt and the 4-year graduation rate.
(4)
The Wall Street Journal/Times Higher
Education
College Ranking (2017) is an important new
ranking list. Unfortunately, it does not take into account a
college’s financial aid or net cost. Touted as its distinctive
factor is the 20% given to
Engagement, most of which (17%) is drawn from answers
to THE US Student Survey online of more than 100,000 students
that asks students to answer an online survey of twelve questions on
multiple choice or a scale of zero to ten* (the final 3% is “the
number of different subjects taught” at the college; source:
IPEDS). Of the remaining three sections,
40% is allotted to
Outcomes, which involves graduation rates (11%; source:
IPEDS), “value added to graduate salary” 10 years after entering
college (12%) and “value added to the loan repayment rate” as a
percentage of “students who have repaid some portion of their loans”
(7%),** and “academic reputation” (10%; “based on Times Higher
Education’s annual Academic Reputation Survey, a survey of
leading scholars”). Then
30% is allotted to Resources, including “the
amount of money each institution spends on teaching per student,”
both undergraduate and graduate programs (11%; source: IPEDS), “the
ratio of students to faculty members” (11%; source: IPEDS), and “the
number of published scholarly research papers [source: Elsevier] per
faculty [source: IPEDS]” 2011-2015 (8%). Finally, 10% is
allotted to
Environment, comprising “the proportion of international
students” (2%; IPEDS), student “racial and ethnic diversity” (3%;
source: IPEDS), “the inclusion of students with lower family
earnings” (2%; “the proportion of students that are first generation
students as reported in College Scorecard” and “the proportion that
receives Pell Grants … as reported in IPEDS”), and “the racial and
ethnic diversity of the faculty” (3%; source: IPEDS). There are
various reasons why some colleges could be excluded from the
rankings (e.g., fewer than 1000 students enrolled or lacking at
least 50 students who responded to their online survey).
*To
assess (a) “engagement with learning” (7%), four questions are
asked: “To what extent does the student’s college or university
support critical thinking…; to what extent does the teaching
support reflection upon, or making connections among the things
the student has learned …; to what extent does the teaching
support applying the student’s learning to the real world …; and
finally, to what extent did the classes taken in college
challenge the student….” (b) To assess “interaction with
teachers and students” (4%) two questions are asked: “To what
extent did the student have the opportunity to interact with
faculty and teachers…; and to what extent does the college
provide opportunities for collaborative learning….” (c) To
assess “student recommendation” (6%) one question is asked: “If
a friend or family member were considering going to university,
based on your experience, how likely or unlikely are you to
recommend your college or university to them?”
**One problem here is that the figures are
derived from the U.S. Department of Education's College
Scorecard, which reports only on students who have received
federal aid (federal loans or Pell grants), which at many
high-end schools will represent only a very small percentage of
graduates (e.g., at Harvard, Princeton, Stanford, and Yale the
percentage of students receiving federal Pell grants and/or
federal student loans is between 9-18%), though nationally 70%
of graduating students receive federal loans or Pell grants.
Another problem is “value added,” by which is meant not the
actual salary and loan repayment rate “in absolute terms” but
how these figures exceed or fall below “expected” figures,
predicted (dubiously in my view) from “a wide range of factors,
such as the make-up of its students and the characteristics of
the institution.” The purpose of a “value added” assessment is
to avoid “rewarding” an institution for attracting first-rate
students would be likely to succeed at almost any institution of
higher learning.
(5) Not
surprisingly,
Money’s
736 “Best Colleges (2016-17)” gives special attention to assessing
graduates’ earnings (through various measures), alongside the
quality of the education (graduation rates, peer and instructor
quality) and affordability (net price of college for all and for
low-income families in particular; also debt at graduation, loan
default odds).
(6)
College Factual’s
1388 “Best Colleges” list
(2017), which is backed by USA Today, pays special attention
to standardized test scores of the freshman class, retention and
graduation rates, and the student loan default rate, alongside
educational resources (faculty compensation, expenditures per
student, student-to-faculty ratio, percent of full-time teachers)
and alumni salaries.
(7)
College Raptor’s
“50 Best Colleges” (2017) is extended to 300 schools in a
“raw” list
that is regularly updated. Particular focus is given in this list to
retention and graduation rates, alongside SAT/ACT scores, average
faculty salary, student-to-faculty ratio, selectivity index, and
endowment per student. The raw list was last checked on 9/16/16.
(8)
Kiplinger’s
300 “Best College Values” (2017) is (as the name suggests) notable
for the significant weight (almost half) that it gives to a school’s
affordability (net price and student indebtedness). It also
evaluates admission and yield rates, SAT/ACT scores, retention and
graduation rates, and the student-to-faculty ratio.
(9)
Niche’s
top 100 “Best Colleges” list (2017) extends to
a top 250
and indeed a top 1164 schools when individual searches are done.
Distinctive to Niche is the weight given to student and alumni
surveys from nearly 90,000 unique Niche users. These surveys are
merged with data from the acceptance rate, average loan amounts,
alumni earnings, faculty awards, student-faculty ratio, diversity
(ethnic diversity and the proportion of out-of-state and
international students), safety, athletics, campus food and housing,
and the quality of the local area.
(10) The
PayScale
“College ROI Report” (2016) evaluates schools based on the single
consideration: the 20-year net return on investment. This is the
difference between the 20-year median pay for a 2014 Bachelor’s
graduate (with no higher degree) and the 24-year median pay for a
2014 high school graduate, minus the total 4-year cost of attending
the college for a graduate of 2014. Schools that have strong
engineering programs and other lucrative “technical” fields of study
typically do well here; liberal arts colleges without such focus
generally do not, although there are notable exceptions. Obviously,
educating students in lucrative occupations is not the only mark of
a quality education but for many it is a vital consideration. The
accuracy of such a method is questionable, given that it is not a
scientific random sampling of alumni but a gathering of data from
employers and employees who go to PayScale’s website to find out
what is appropriate compensation for certain professions; moreover,
the sample size is often extremely small. Still, a better mechanism
for estimating the return on college investment does not yet exist.
One has the option to assess the total 4-year cost “without” or
“with” financial aid; I chose “with.”
Other lists that
readers might want to check include:
Best Colleges’
“Top 50 Colleges & Universities in America for 2016” is distinctive
in giving attention to “the quality of life offered by the city or
town it is located in” (accounting for almost a third of the rating:
cost of living index, median age of residents, median household
income, and percentage of residents with a bachelor’s degree or
higher). The list also takes into account the school’s net price,
the average salary of graduates, the school’s acceptance and yield
rates, student/faculty ratio, and the school’s retention and
graduation rates. The limitation to 50 colleges has made it
difficult to include results for a list almost three times that
size.
Business
Insider’s
“The 50 best colleges in America” (2016) is improved significantly
over its 2015 list where it used just three stats: 50% to a survey
of over 1,000 Business Insider readers; 25% to the average
SAT scores; and 25% to the median starting salaries of graduates.
Now six indicators are used, totaling 10.5 points, mostly gathered
from
the Department of Education College Scorecard Data:
3 points for “graduation rate within four years”; 2 each for “median
earnings of students working and not enrolled” 6 and 10 years “after
entry”; 2 for
student life experience, as measured by
Niche (“campus quality, diversity, party scene, student
retention, safety, and athletics”); 1 for “full-time retention rate
in 2014”; and .5 each for “average annual net cost,” “percent
admitted,” and “average SAT score.” I did not make use of the list
because it is limited to the top 50 and the authors were previously
unwilling to supply data beyond that. Here are there results: 1.
Princeton. 2. Harvard. 3. Yale. 4. Stanford. 5. Vanderbilt. 6. MIT.
7. UPenn. 8. Rice. 9. UVirginia. 10. Columbia. 11. Georgetown. 12.
UMichigan. 13. Notre Dame. 14. UCal Berkeley. 15. Cornell. 16. Duke.
17. Washington U in St. Louis. 18. Colgate. 19. UCLA. 20. Brown. 21.
Bowdoin. 22. Washington & Lee. 23. UChicago. 24. U Southern Cal. 25.
Northwestern. 26. Emory. 27. Tufts. 28. U North Carolina. 29.
UMaryland. 30. Claremont McKenna. 31. Dartmouth. 32. Pomona. 33.
Boston College. 34. URichmond. 5. Davidson. 36. Johns Hopkins. 37.
Lehigh. 38. Boston U. 39. Santa Clara U. 40. Williams. 41. Caltech.
42. Middlebury. 43. UIllinois. 44. Bucknell. 45. UFlorida. 46.
Amherst. 47. New York U. 48. George Washington U. 49. Hamilton. 50.
Babson.
Value Colleges’
“Top 50 Best Value Colleges of 2015” simply takes (1) the 20-year
net ROI from
Payscale.com
(above, though using 2014 figures) and combines it with (2) average
debt statistics from the
Princeton Review 2013
Best Value Colleges report
and (3)
IPEDS
6-year graduation rate statistics. I dropped it for the same reasons
that I dropped Business Insider’s list.
The
Washington
Monthly
college ranking (2015) is an ‘outlier ranking’ that puts the
emphasis not so much on how much a university or college benefits
any given enrolled student as on what schools give back to society.
This involves three components: (a) Social mobility, defined as
“recruiting and graduating low-income students” (determined by the
percentage of Pell grant recipients) at a reasonable price (a
“cost-adjusted graduation measure” defined as the difference between
the “actual” and “predicted” graduation rates, divided by the
net price of attendance); (b) Service, measured by the number of
alumni serving the Peace Corps, the size of the ROTC program, and
the percentage of federal work-study grant money spent on community
service projects; and (c) Research, based on the amount of research
spending, the number of science and engineering PhDs awarded, the
proportion of alumni who have gone on to receive a PhD, the
proportion of faculty receiving prestigious awards and having
membership in national academies.
I had two main
problems with the list that led me to drop it. First, it was
difficult to make use of the separate list for liberal arts colleges
because the five research categories used to evaluate national
research universities were scaled down to two for liberal arts
colleges. Even the best liberal arts colleges cannot match the top
200 research universities in research expenditure and PhDs awarded
(and perhaps also faculty awards and academy memberships). Second, I
had serious reservations about using the
WM ranking for helping students to assess which are the best
schools to send an application. Schools that have low graduation
rates are rewarded over schools with high graduation rates because
it is easier for the former to exceed a low predicted
graduation rate. As far as net price is concerned, there is no
factoring in of the “free ride” that many Ivy League schools offer
students with family income low enough to qualify for Pell grants.
Furthermore, why having a larger number of students in ROTC or of
alumni serving in the Peace Corps makes a school a more attractive
choice to an applicant is not clear, particularly since such
involvement will always account for only a small percentage of the
total student body and alumni. Frankly, there is something wrong
with a list that rates UCal San Diego first, UCal Riverside second,
and Texas A&M third among national universities while ranking
Princeton twenty-sixth, Duke thirty-first, UPenn thirty-seventh,
Yale forty-forth, Caltech forty-seventh, Columbia forty-ninth,
UChicago fifty-fifth, Dartmouth sixty-forth, Northwestern
one-hundred-sixth, and Brown one-hundred-thirteenth.
As regards how I
tallied the cumulative scores, I began by dropping a non-ranking
score (whether because of insufficient data or because the school
ranked below the list’s limited number of schools); if all lists
ranked the school in question, I did a strikethrough of the largest
(i.e. worst) number, the negative outlier. This left nine scores to
add. If all ten lists ranked the school in question I put that
cumulative score in parentheses. When a school had a higher (worse)
number with one dropped list than another school but a lower
(better) number when no lists were dropped, I generally resolved the
problem by assessing which school “won” the most head-on comparisons
in mutually shared lists. When there was a tie I compared each
school’s SAT and ACT scores. There were further qualifications:
(1) The reader will
notice that I first add the two scores from US News and
College Choice, then multiply by two; for liberal arts colleges
I then add an additional 30. Why? Both rankings have two separate
lists for research universities and liberal arts colleges. There is
no perfect way of merging each of the two lists into one each. For
research universities I decided to multiply the ranking for a given
school by two in order to adjust for incorporation into a list that
also contained liberal arts colleges. For liberal arts colleges I
not only multiplied by two but also added 15 points to each of the
two lists. I did so because I found that rankings in a list of
liberal arts colleges averaged 15.8 points higher (better) than the
average rating for the same school in composite lists consisting of
both national research universities and liberal arts colleges. In
other words liberal arts colleges on average drop 15.8 points lower
on composite lists than do national research universities.
(2) I did not drop
the scores from US News, College Choice, Forbes, and
WSJ/THE
even if they were among the worst scores. This was in part a nod
to the significance of the US News, Forbes, and
WSJ/THE ratings systems and in part a way of coping with the
division between universities and colleges drawn by both US News
and College Choice.
(3) A “t” after a
given number indicates a tie with one or more other schools in a
given list. It does not get carried over into the final cumulative
tally.
(4) There is the
thorny question of how to evaluate public state schools that give
a much-reduced tuition rate to in-state students. Of the nine
rankings lists consulted here, four did not factor in net price
(average cost after financial aid) as a consideration of a school’s
ranking (Forbes, College Factual, College Raptor, Niche). For
these rankings obviously the issue of in-state cost vs. out-of-state
cost is irrelevant. However, for the remaining five rankings the
issue is relevant. Of these, two used out-of-state net price:
US News
and of
Kiplinger’s
combined rankings.
Two made use of the in-state net price:
College Choice
(confirmed in email correspondence with CC) and
Money.
The PayScale College ROI Report offers both an
in-state rank and an out-of-state rank. I used the out-of-state rank
in PayScale ROI for ordering public/state universities but in
each case note as well what the ranking of the given school would be
if the in-state PayScale ROI rank were adopted. The GCR is
thus a composite of both rankings that factor in-state net price for
public universities and rankings that factor out-of-state net price.
There are good arguments for both methods of evaluating cost. In
favor of an in-state consideration is the fact that the overwhelming
majority of students at public state schools are in-state (e.g., at
UCal Berkeley, 85% of the students are in-state). In favor of an
out-of-state pricing is the fact that a comparison is being made
with national private universities and colleges. If public
universities are to be treated as
national universities, they ought to be evaluated on an
out-of-state basis. Potential applicants will be able to get (at
most) one or two in-state prices for the roughly 50 public
universities included in this list. It is unhelpful to clutter a
list with rankings based in part on net prices of which only a tiny
percentage of the national applicant pool can take advantage.
Finally, after the ratings I provided additional
information about each school that allows readers to make their own
assessments:
(1)
The standardized test scores of the enrolled
Class of 2019 that entered in Fall 2015 (where unavailable, I
substitute the test scores for the Class of 2018 that matriculated
in Fall 2014).
(Note that I do not indicate what percent of enrolled
students graduated in the top 10% and 25% of their high school. The
reason for this is that generally fewer than half of the enrolled
students at top schools come from high schools that provide a class
rank.)
(2) Information about
the school’s selectivity: acceptance rate, yield, and selectivity
index. The selectivity index is really a desirability index,
reflecting how much students want to get in the school by dividing
the acceptance rate by the enrollment (yield) rate.
(3) The net price
of the school after scholarship and grant aid was deducted from the
total cost, not only for the average student but also for low-income
students. The figures come from the
National Center for Education Statistics (NCES) College Navigator
site and at an individual school's website (commonly through their
Common Data Set). Note that I have adjusted each school's data to
correspond to a standard figure for variable expenses (books and
supplies, personal expenses, and travel): $4500. I do this
because the estimates for these expenses at each school vary widely
from $1500 to over $5000. Institutions that drastically
underestimate these expenses publish much lower net prices than
warranted, thereby radically skew their net price ranking relative
to other institutions. A standard figure for variable expenses
eliminates that problem.
(4) The average student debt at graduation and
default rates (the latter as another indication of excessive
debt burden).
(5) A series of pertinent figures: the retention
rate after the first year; the 4- and 6-year graduation rates;
the number of students enrolled
in the Classes of 2018 and (where data exists) 2019, along with the
total student population figure (including any graduate-school
students) and the total undergraduate-only population; the
student/faculty ratio; and the school’s
endowment with its overall ranking in three measures (total
endowment; endowment per student [undergraduate + any graduate
students]; endowment per undergraduate).
(6) The percentage and number of African American
students in the freshman class, as a vital indicator of the
school’s ethnic diversity (where possible, distinguishing between
African-American students who identify solely as such, denoted by an
asterisk, and African-American students who identify as TOMR [two or
more races]).
(7) The earning potential of students as
measured by early career and mid-career average salaries
determined by
PayScale ("Bachelor's Only," not "All Alumni"). As with the
PayScale ROI used in the rankings, PayScale Salary has
sampling problems. These problems result in the ranking of some
schools swinging wildly from year to year when the number of persons
from a given school who visit PayScale’s website and fill out
its required questionnaire is relatively small.
(8) At the end I supply world rankings, which
taken as a composite listing will often look very different from the
U.S. national rankings (though Harvard is still 1st, not
only in terms of relative placement of U.S. schools but also in the
world). The differences are due to a
difference in variables. World rankings do not take into account
a university’s selectivity (which foreign universities don’t
measure; even if they did, they obviously don’t make use of SAT and
ACT scores). Nor do they evaluate earning potential (there are
obvious difficulties in such comparisons across different cultures).
Instead they typically focus on such things as global reputation,
the number of articles published by faculty (particularly in top
science journals) and (to a lesser extent) books, citations of such
publications globally by other researchers, major awards won by
faculty (e.g., Nobel prizes, Field Medals in Mathematics), PhDs
awarded, and internationals among staff and students (see, for
example, the methodology of
Times Higher Education and
US News). These variables, including an emphasis on
quantity, put nearly all small U.S. liberal arts colleges at a
distinct disadvantage in relation to research universities,
resulting in the former’s rare appearance on world lists. The
variables also favor universities that have a heavy focus on
engineering and science, which explains why MIT and Cal Tech beat
out Princeton. As with some U.S. listings (notably USNews)
there are complaints about subjectivity in factoring reputation. The
Times Higher Education (London) did a list jointly with QS (Quacquarelli
Symonds, also a London-based corporation; they specialize in study
abroad) from 2004 to 2009 (with QS providing the data), then split
off from QS because of complaints of too much reliance on subjective
reputation assessments by QS (surveys of academics and recruiters
account for 50% of the rating). THE now collaborates with
Thomson Reuters for data collection (academic reputation still
accounts for 15% weighting). The THE World University
Rankings is generally viewed with the highest regard. Since 2011
THE has also put out a World Reputation Rankings which surveys
over 13,000 academics in over 130 countries (“the
world's largest invitation-only academic opinion survey”). US
News launched its Best Global Universities ranking in 2014 as
the first such US ranking. They too make use of data from Thomson
Reuters.
Finally, immediately after a photograph of each
school I have included a short introduction that does four things:
(1) Summarizes the best and worst scores among the
thirteen rankings lists.
(2) Compares each school to the list of schools that
precedes it in the GCR.
(3) Mentions any recent concerns about whether the
school in question is a hostile environment for students with
convervative-to-moderate religious or political beliefs, recognizing
that the vast majority of schools on this list are left-of-center to
hard-left-of-center.
(4) Gives the evaluation of FIRE (Foundation for
Individual Rights in Education) as to whether the school in question
has implemented speech codes that violate the rights of students,
staff, and faculty. According to their
website,
"the mission of FIRE is to defend and sustain individual rights at
America’s colleges and universities. These rights include freedom of
speech, legal equality, due process, religious liberty, and sanctity
of conscience—the essential qualities of individual liberty and
dignity." A link is provided to additional information about the
individual college with regard not only to speech codes but also to
campus incidents that threaten freedom of speech, due process, and
religious liberty.
Less than 25 schools receive FIRE's highest speech code rating
(a green light) and only a handful of these are among the GCR top
130: University of Pennsylvania, Carnegie Mellon University, College
of William and Mary, University of Virginia, University of North
Carolina (Chapel Hill), Purdue University, and University of
Florida.
(5) Gives where available the
2016 “Campus
Pride” Index rating (from 0 to 5 stars) designating how
“LGBTQ-friendly” a given school is and whether it made the
2015 Campus Pride
Top 25 List of LGBTQ-Friendly Colleges & Universities.
For Campus Pride the higher the score, the better the
institution. For religiously and/or politically
conservative-to-moderate persons, a high score is a sign not only of
an institution’s promotion of sexually immoral behavior and of its
dishonoring of the gendered self (a denial of the fundamental
reality in nature that the only true sexual counterpart to a man is
a woman and to a woman a man), but also of its oppressive
intolerance toward those who believe in the importance of sexual
complementarity for marriage and in the integrity of one’s birth
sex. Such institutions typically foster a hostile environment,
equating moral qualms about homosexual practice and so-called
transgenderism with racism. The usual result is a denial of freedom
of speech and thought, religious liberty, and due process. It can
also surface in practices of coercive indoctrination, shaming,
ostracism, and various sanctions for alleged bias and unreasonably
broad interpretations of what constitutes harassment. This
intimidation may occur in classrooms, regular convocations, media,
and casual conversations.
The fact that schools
such as Columbia, Amherst, and Bowdoin (4 stars each; all
institutions known for their intense zeal in promoting the
homosexual and transgender cause) didn't make
Campus Pride's
Top 25
list indicates just how extreme a school has to be in order to reach
that unhallowed position. It requires unceasing recruitment,
indoctrination, special resourcing, and sanctions. Note too that
many universities and colleges that are obviously avid in promoting
homosexualism and transgenderism are not listed in Campus Pride's
Index database at all (including Harvard, Stanford, Yale, Brown,
Dartmouth, Vanderbilt, Swarthmore; only a little over 200 schools
are assessed). This merely indicates that they didn't fill out the
necessary paperwork to receive a rating. So absence from the top 25
list or from the Index is most often not an indicator that the
school does not push this agenda intensely.
For “Campus
Pride” a high score is indicative of having in play nearly 100
elements, including (but not limited to) the following:
affirmative-action efforts at recruiting into the student body
persons who identify as gay, lesbian, bisexual, or transsexual;
providing special scholarships for such; special retention efforts
such as an “LGBTQ mentoring program,” regularly planned social and
“educational” LGBTQ events, and a special graduation ceremony for
LGBTQ students and allies; actively targeting for faculty and staff
hiring persons who visibly identify as gay, lesbian, bisexual,
transgender, or no gender; providing a resource center/office for
LGBTQ students, with paid staff responsible for LGBTQ “support
services”; maintaining “an ongoing Safe Zone, Safe Space and/or Ally
training program that are offered at a minimum annually to educate
students, faculty and/or staff on LGBTQ issues and concerns”; having
a “standing advisory committee that deals with LGBTQ issues,” an
“LGBTQ alumni group,” an “LGBTQ faculty/staff organization,” “LGBTQ
& Ally student organizations,” an “LGBTQ fraternity/sorority,” and
“LGBTQ-inclusive career services”; having an LGBTQ studies program
and specific course offerings; making “a concerted effort to
incorporate LGBTQ issues into existing courses” and to “address
[negatively] heteronormativity and gender normativity in the
curriculum/classroom”; amply stocking libraries with LGBTQ-affirming
books and periodicals; implementing a program for “training” all new
faculty and staff to affirm homosexuality and transgenderism;
embracing “non-discrimination” (affirmation) statements concerning
“sexual orientation” and “gender identity”; mandating that “senior
administrators (e.g., chancellor, president, vice-president,
academic deans, senior diversity officer) attend campus LGBTQ
events/activities in a visible, ongoing manner” and “explicitly
include the terms ‘sexual orientation,’ ‘gender identity/expression’
and ‘lesbian, gay, bisexual and transgender’ when publicly
discussing multicultural and/or diversity issues on campus”;
developing a “simple process” for students to change their name and
gender identity (requiring all to use the new name, e.g., calling a
man Sally or a woman David, even in the absence of any legal change
or “sex-reassignment” surgery) and to specify what pronouns apply to
them; having a “procedure for reporting LGBTQ related bias incidents
and hate crimes,” “active ongoing training for hate crime
prevention,” and training campus police on sexual orientation and
gender identity issues; as regards housing issues, setting aside
“LGBTQ living space, theme floors and/or living-learning community,”
offering “roommate matching for LGBTQ students to find LGBTQ-friendly
roommate,” “gender-inclusive housing,” “gender-inclusive/single
occupancy restroom” restroom and shower facilities, and residence
life staff trained to address affirmatively all “LGBTQ issues and
concerns”; having “LGBTQ
counseling/support groups,” “trans-inclusive trained counseling
staff,” “free, anonymous and accessible HIV/STI testing,”
“LGBTQ-inclusive health information and safer sex materials
available,” and a “trans-inclusive student health insurance policy
which covers ongoing counseling services” and “hormone replacement
therapy.” In other words, at every level of university or college
life, there is a stranglehold insistence on catering to every
homosexual and transsexual wish and co-opting every conscience for
this purpose.
This is a work in process. I will add entries as time
and desire permit.
1.
Harvard
University,
Cambridge, MA

"Apple Picking 070" by QuarterCircleS - Own work.
Licensed under GFDL via Wikimedia Commons -
https://commons.wikimedia.org/wiki/File:Apple_Picking_070.jpg#/media/File:Apple_Picking_070.jpg
Rankings:
US News (NU) 2 +
College Choice (NU)
2 × 2 = 8; plus…
Forbes 4
WSJ/THE
6
Money 3
College Factual 2
College Raptor
2
Kiplinger 6
Niche 4
PayScale ROI
11
Total,
with unranked or worst (outlier) score dropped, then full score:
35
(46)
As the oldest and most
prestigious college in America, with the world's largest endowment
by far and the largest academic library, Harvard will always be the
school by which all other claimants to first place must measure
themselves. Although few people would be surprised that Harvard
University could be ranked first among American colleges and
universities, perhaps most people would be surprised that none of
the U.S. lists consulted here ranks Harvard
first.
However,
no other school came so consistently close to being no. 1. In nine of
the ten lists it ranked in the top 6: Four ranked it
second
(USA Today's
College Factual, for the second year in a row; fourth in
2015;
College Raptor, same as last year;
and, exclusive of
liberal arts colleges, US News [same as previous year] and
College Choice); one ranked it third (TIME's
Money Magazine, up from last year's sixth); two fourth
(Forbes, up slightly from last year's sixth; Niche,
same as 2016's and down slightly from 2015's third); and two
sixth (Wall St. Journal/Times Higher Education; Kiplinger,
same as the previous two years). Only its PayScale rank drops
below sixth (and even then a still respectable eleventh). In
the GCR composite list of the top six
world rankings Harvard occupies the top spot.
Harvard excels in just about
everything, including its financial aid. It ranked a truly
impressive
first in lowest average net price among the top 133 GCR
schools
for beginning undergrads receiving any financial aid in
2014-15
(first also in 2013-14). Broken down into parental salary levels, in
2014-15 for beginning undergrads it ranked (inexplicably to me) only
twelfth for incomes $0-$30,000 (2013-14: second), sixth for
$30,001-$48,000 (2013-14: fourth), only fifteenth for
$48,001-$75,000 (2013-14: second!), and a shockingly low
seventy-second for $75,001-$110,000 (2013-14: twentieth!).
Unfortunately stats for 2014-15 for all undergrads receiving
financial aid and for 2015-16 for beginning undergrads and then for
all undergrads are not yet available due to Harvard's lag in
publishing its Common Data Set information. Harvard's average
student loan at graduation for that portion of the Class of 2015
taking out any loans was the tenth lowest among the GCR top
139 schools; and the percentage of students graduating with debt
was the seventh lowest. Harvard is also in a 3-way tie
for fifth lowest percentage of students graduating with any debt.
Most of Harvard's other measurable characteristics
put it in the top four: (1) first-place endowment (not only
in the US but also in the world: $36.7 billion, $12 billion than
second-place Yale), which is also (2) first per undergrad and
(3) third per student
(incl. grad students); (4)
first-place 6-year graduation rate; (5) second-place
acceptance rate
(5.575%), (6) yield rate (79.8%), and (7)
selectivity
(desirability) index, in each instance just behind Stanford (which
has less competition on the West Coast); (8) third-place average
net price in 2015-16 for beginning undergrads receiving any
financial aid (estimated); (9) third-place C2018 admission test
scores for both the SAT (1505 for CR+M and 2260 for CR+M+W) and
the ACT (33.5; 6-way tie); and (10)
second to fourth place net price averages in 2013-14 for all
levels of parental income under $75,000). No parental
contribution is expected for families with an income of less than
$65,000 and financial aid packages are no-loan.
Strong but a bit less
impressive by Harvard's high standards are its (1) tenth-place
(tie)
PayScale Mid-Career Salary ranking among all schools; (2)
fourteenth lowest student-to-faculty ratio (8 to 1); (3)
fifteenth-place first-year retention rate (still 97%; 10-way
tie; only 2% off the top 99% score); (4)
sixth- to fifteenth-place net price in 2014-15 for parental
income levels ranging from $0 to $75,000; (5) twentieth-place
for African-American student representation
(7%; fourth among the Ivies but only .6% off the first Ivy,
Princeton; and only .85% off of the seventh-place overall UNC).
There are only two areas
where Harvard could exert itself for some improvement: (1) its
thirty-third place 4-year graduation rate (86%, 6.2% off of
top-ranked Middlebury trailing, inter alia, Princeton,
Columbia, Dartmouth, UPenn, Yale, and Duke); and (2) its “red
light” FIRE rating, where it has “at least one [speech code]
policy that both clearly and substantially restricts freedom of
speech.”
Based on political donations of the people who work there, Harvard
University is the 210th most liberal university out of 446 (7.7
Liberal;
CrowdPac). This is the
forty-first most liberal school among the 84 schools of the
GCR Top 133 that Crowdpac examines.
Test scores
(Fall 2014 / C2018 enrolled students)1
Mid-50% (25th -75th
percentile): SAT CR 700-800, M 710-800, W 710-800, ACT 32-35*
Average: CR+M: 1505 (avg. 752.5), ranked 3rd
(tie);
CR+M+W:
2260 (avg. 753.3), ranked 3rd;
ACT
33.5, ranked 3rd (6-way tie)
Percent submitted SAT/ACT scores
(2014): 85%/35% (2013: 86%/38%)
*In a C2019
survey of about 70% of students Harvard reported that “the average
best overall SAT score of respondents was 2229 [avg. 743; C2018:
2237; avg. 746]…. The average best overall SAT score reported by
white respondents was 2218; 2174 for respondents who are Hispanic or
Latino; and 2149 [avg. 716; C2018: 2157, avg. 719; C2017: 2107, avg.
702] for respondents who are black or African American [and 2300 for
Asian, not incl. South Asian].” This indicates an SAT boost for
enrolled Black students of only 80 points. For C2018 around 8% of
all respondents reported a perfect 2400 SAT score.
http://features.thecrimson.com/2015/freshman-survey/makeup/
Selectivity
Acceptance rate: Fall 2012: 5.92% / 2013:
5.79% / 2014:
5.57% /
2015:
5.575%
(2nd)
Yield
rate (% of accepted students who enroll) Fall 2014
(C2018):
85.34% / Fall 2015 (C2019):
79.81%
(2nd)
Selectivity index (acceptance ÷ yield: the
lower the score the more desirable):
.0720 (2nd)
:
Net Price (total expenses –
grant/scholarship aid; rank exclusive of in-state public university
n.p.)
Net price
average
2013-14
(from NCES) for beginning undergrads receiving any financial aid:
$16,052
(1st)
Net price
average
2014-15
(from NCES) for beginning undergrads receiving any financial aid:
$16,599
(1st)
Net price
average 2015-16 for beginning undergrads…:
$16,359 (total costs
$65,159 - average need-based scholarship about
$48,800)* (3rd)
*Data from
Harvard's
website; like the CDS figures it includes "Harvard, federal, and
outside scholarships" and excludes parents' contribution, student
asset and summer work expectation, and term-time work expectation.
The stats for 2013-14 and 2014-15 are from the NCES government site
where the need-based scholarship includes only institutional and
federal scholarships and not other outside scholarships, thus
usually resulting in slightly higher net prices.
By income (2013-14)
for beginning undergrads...:
$0 - $30,000: $3430 (2nd) / $30,001 – $48,000: $4823 (4th)
/
$48,001 – $75,000: $7267 (2nd) / $75,001
– $110,000: $22,915
(20th)
By income (2014-15)
for beginning undergrads...:
$0 - $30,000: $7460 (12th) / $30,001 – $48,000: $5693 (6th)
/
$48,001 – $75,000: $13,024 (15th) /
$75,001 – $110,000: $29,297 (72nd)
No parental contribution expected
for families making less than $65,000.
The only payment expected is from the student’s
summer earnings, part-time employment, and any savings the student
may have.
Families making between $65,000 and $150,000
contribute from 0-10% of their income.
“Ninety percent of American families would pay the same or less to
send their children to Harvard as they would a state school.” The
average grant of $46,000 covers the cost of tuition ($45,278 for
2015-16).
Harvard offers
no-loan financial aid packages to all students who receive
financial aid.
Debt at
Graduation (incl. rank among the GCR top 133) and Default Rates
Average student debt at graduation
C2014: $15,117 (8th
lowest) / C2015: $16,723 (10th
lowest)
Percentage of
graduates with debt:
C2014: 26%
(5th
lowest) / C2015: 24%
(7th
lowest)
Student loan default rate
2010: 1.5% / 2011: 1.9% / 2012: .9% /2013: .8%
[4-yr avg.: 1.275%; 3-yr avg:
1.2%]
Graduation
Rates, Student Enrollment, Student/Faculty Ratio, Endowment
1st-year retention
rate (2013-14): 97.00% (in
a 10-way tie for 15th)
4- & 6-year graduation
rate
(began Fall 2008): 85.9% (33rd) /
97.7%
(1st)
Entering class size:
C2019: 1665 (C2018:
1659);
Student enrollment (2014-15):* 20,828 (6636 undergrad)
Student to faculty ratio: 8 to 1 (in a
14-way tie for 14th
lowest among the top 130 schools)
Endowment
(2016):
$34.54 billion (1st
in the world; in the US 3rd
per
student and 1st
per undergrad)
*So the 2014-15 CDS. Enrollment
figures for some reason vary widely depending on the source
consulted. The US government’s own
NCES states: “Student population: 28,791 (10,338
undergraduate).” The
SAT College Board reports total undergraduates 6694 (of which
6636 are degree-seeking) and graduate enrollment 4,109 for a grand
total of 10,803 (10,745 degree-seeking). On their website in “Harvard
at a Glance” (2015) they list “about 6,700” students at Harvard
College and another “about 14,500” consisting of “graduate and
professional students,” leaving a total of “about 21,000.”
Wikipedia, citing a pdf no longer on Harvard’s site (“Degree
Student Head Count: Fall 2010”) subdivides the non-undergraduate
student population (as of Fall 2010) into “3,738 students in
graduate programs, and 10,722 students in professional programs.” I
have no idea how the NCES arrives at an undergraduate population of
about 3700 more (and a total student population of about 8000 more)
than what one reads from Harvard’s own website, its Common Data Set,
and the SAT College Board.
African American
Representation as a Measure of Diversity
Average number (and %) per class over 4 undergrad classes,
*no TOMR (Fall 2014): 116* (6.98%) (20th
in GCR)
Number
(* = excl. those of TOMR): C2019: 157; C2018:
118* (177); C2016: 116* (150)
# National Achievement Scholarship Winners (2014): 69
N.B.: TOMR = Two or More
Races. C2019 AfrAm 10.6% (prob. of non-Internationals; so 88.8% x
1665 x 10.6% = 157; incl multi-racial.
https://college.harvard.edu/admissions/admissions-statistics.
Compare C2018 Black 12% (prob. of non-Internationals; so 88.8% x
1662 x 12% = 177; incl multi-racial):
https://college.harvard.edu/admissions/admissions-statistics.
The 177 number is confirmed here:
https://www.jbhe.com/2014/05/a-record-number-of-black-first-year-students-to-enter-harvard-this-fall/.
Earning
Potential
PayScale Salary 2016-17:
Early career (0-5 years of employment):
$65,200; Mid-career (10+ years):
$123,000 (10th, tied)
World Rankings
The
Times Higher Education World University Rankings (UK)
2016-17: 6
The Times Higher Education World Reputation
Rankings (UK) 2016: 1
QS World University Rankings
(UK) 2016/17: 3
US News Best Global Universities Rankings
2017: 1
Academic Ranking of World Universities
(Shanghai) 2016: 1
Center for World University Rankings
(Saudi Arabia) 2016: 1
Composite Score: 13 (1st in the world)
FIRE Speech Code Rating (Green:
protects; Yellow: may restrict;
Red:
clearly restricts)
 Harvard
University has been given the speech code
rating Red. A red light university has at
least one policy that both clearly and
substantially restricts freedom of speech.
Read more
here. Harvard
University has been given the speech code
rating Red. A red light university has at
least one policy that both clearly and
substantially restricts freedom of speech.
Read more
here.
2.
Princeton University,
Princeton, NJ

"Firestone Library, Princeton University,
Princeton NJ" by John Phelan - Own work. Licensed under CC BY-SA
3.0 via Wikimedia Commons - https://commons.wikimedia.org/wiki/File:Firestone_Library,_Princeton_University,_Princeton_NJ.jpg#/media/File:Firestone_Library,_Princeton_University,_Princeton_NJ.jpg
Rankings:
US News (NU) 1 +
College Choice (NU)
7 × 2 = 16; plus…
Forbes 3
WSJ/THE
8
Money 1
College Factual 9
College Raptor
1
Kiplinger
3
Niche 5
PayScale ROI 6
Total, with unranked or worst (outlier) score dropped, then full
score: 43
(52)
Princeton University
is ranked in the top three in five of the ten lists, including
four of the five or six most significant lists:
thrice first (US News for national universities,
for the sixth straight year;
Money, up slightly from last year's third; and College
Raptor, same rank as last year), once second (Kiplinger,
up slightly from last year's first), and
twice third (Forbes, highest of the Ivies, up
slightly from last year's fourth; and Kiplinger, down
slightly from 2016's second and 2015's first, still highest
among private universities as opposed to liberal arts colleges
and public universities). In none of the lists is it ranked
out of the top 10: fifth (Niche, up from
2016's eleventh and 2015's seventh), sixth (PayScale’s
ROI, second-highest among the non-tech schools and highest
among the Ivies, up slightly from last year's seventh),
seventh (College Choice for National
Universities),
eighth (Wall St. Journal/Times Higher Education),
and
ninth (USA Today's College Factual, for the second
year in a row; eighth in 2015). US News also ranks
Princeton the #1 in
Best Undergraduate Teaching among National Universities. In the GCR composite list of the
top six world rankings it averages seventh in the
world (behind Harvard, Stanford, MIT, Cambridge, Oxford, and
Caltech).
Princeton is a financial
aid marvel. In 2014-15 it ranked an impressive second
in lowest average net price among the top 133 GCR schools
for beginning undergrads
receiving any financial aid (surpassed only by Harvard;
Princeton was fourth in 2013-14). [This ranking, compiled
from NCES figures adjusted for standard expenses, does not
factor in private outside scholarships; when factored in (using
CDS figures), Princeton ranked first in 2014-15 (but stats not
yet available for competitors Harvard and Columbia).] Broken
down into parental salary levels, in 2014-15 for
beginning undergrads it ranked an impressive third for
incomes $0-$30,000
(2013-14: fifth), fourth for $30,001-$48,000 (2013-14:
third), third for $48,001-$75,000 (2013-14: first), and
seventh for $75,001-$110,000 (2013-14: fourth; compiled from
adjusted NCES figures). For all undergrads receiving any
financial aid in 2014-15 (compiled from CDS figures that factor
in private outside scholarships) it ranked an impressive first
(stats not available for Harvard and Columbia). As for average
net price in
2015-16 (private outside scholarships factored in) it
ranked an impressive first both for beginning undergrads and
for all undergrads (but stats not yet available for
competitors
Harvard, Stanford, Columbia, MIT, UPenn, Duke,
and Pomona).
As the original no-loan
college in America, Princeton's average student loan at
graduation
for that portion of the Class of 2015 taking out any loans
was the lowest among the GCR top 139 schools; and
the percentage of students graduating with debt was also the
lowest (edging out Yale by a single point). Princeton
expects
no parental contribution for families making less than
$60,000 and offers free tuition for families making less
than $140,000.
Princeton’s other stats
are also amazing. Princeton has the highest endowment per
student (undergrad + grad) in the nation, the third highest
per undergrad-only (behind Harvard and Yale), and the fourth
highest endowment for a single institution in the nation
(possibly in the world; last year [2015] it overtook Stanford
but Stanford inched ahead this year). On top of all this,
Princeton (the second smallest of the Ivies) has the third
lowest student-to-faculty ratio (behind only MIT and
Caltech). It also has
the second highest 6-year graduation rate (behind only
Harvard), and the fourth highest 4-year graduation rate
(higher than all other Ivies, Stanford, MIT, and Duke). In
addition to its seventh place rank in PayScale’s ROR, it is
rated third highest (tie) in Mid-Career Salary.
As one might expect,
Princeton is highly selective and desirable, with the fourth
highest yield rate
(68%), fifth lowest acceptance rate (7%), and fifth
best selectivity (desirability) index. With respect to test
scores for entering freshmen, it is tied for the fifth
highest SAT scores (with Writing; eighth without Writing)
and third highest ACT composite score (6-way tie).
Perhaps it will be surprising to many that it has the
ninth highest African-American student representation,
with only three GCR top 30 schools ahead of it (Amherst, Duke,
and Vanderbilt; tied with Williams) and tops in the Ivies. The
only major statistic in which Princeton falls below the top 10
is in its
first-year retention rate (just barely: eleventh,
tied) and even that figure is impressive (97.4%).
The only areas of
disappointment for conservative-to-moderate students will be
Princeton’s unfortunate ‘red light’ rating from FIRE for having
“at least one policy that both clearly and substantially
restricts freedom of speech” and its selection by “Campus
Pride” as one of the “Top 25 LGBTQ-Friendly Colleges and
Universities in 2015” (with a 4.5 out of 5 evaluation). In its
Orientation Week entering students are forced to sit through
indoctrination sessions promoting sexual promiscuity and the
homosexual/transgender agenda.
Ivy League schools are
not bastions of conservative-to-moderate Christian thought and
Princeton is no exception. In November 2015 the President's
office was occupied by some students who were
protesting any honoring of Woodrow Wilson because of
Wilson's racist views (Wilson was President of Princeton
before becoming NJ governor and then US President). One of their
demands was to remove Wilson's name from the prestigious School
of Public and International Affairs and the first of its
residential colleges, even though Wilson (in other respects a
"progressive" of his day) was being honored for his positive
contributions, not his racism. (A possible inconsistency on the
part of student protestors: They tolerate the fact that our
country's capital, which also contains the Washington Monument,
and the state of Washington are named after a slaveholder.)
Some concessions were made immediately by the administration
and no disciplinary actions were taken against the occupiers
(would pro-life or pro-natural-marriage protestors occupying the
president's office have received the same amnesty?). The move by
the protestors did not have universal support (see this
nicely argued response by a newly formed student group to
counteract the suppression of alternate viewpoints). In the end
an ad hoc committee recommended that Wilson's name not be
removed and
the Board of Trustees agreed.
On the positive side,
Princeton has adopted the strong
UChicago statement supporting free speech (the first and, to
date, only Ivy League school to do so) and has a strong
moderate-to-conservative Christian presence on campus in terms
of both a number of Protestant and Catholic student groups
(arguably the strongest presence among the Ivy Leagues) and not
a few faculty (including most notably Robert George, professor
of jurisprudence, who has written well in favor of a male-female
foundation for marriage and of the right to life of unborn
children).
Based on political donations of the people who work there,
Princeton University is the 200th
most liberal university out of 446 (7.8 Liberal;
CrowdPac). This is the
thirty-seventh most liberal school among the 84 schools
of the GCR Top 133 that Crowdpac examines.
Test scores (Fall
2015 / C2019 enrolled students)
Mid-50% (25th
-75th percentile): SAT CR 690-790, M
700-800, W 710-790, ACT 32-351
Average: CR+M:
1490 (avg. 745), ranked 8th;
CR+M+W:
2240 (avg. 746.7), ranked 5th (tied);
ACT
33.5, ranked 3rd (6-way tie)
Percent submitted SAT/ACT scores:
80%/36% (2014: 84%/36%; 2013: 86%/33%)
1
According to the Princeton website, the percent of students
admitted in each SAT range for C2019 was: 2300-2400 14.5%;
2100-2290 8.1%; 1900-2090 5.2%; 1700-1890 2.1%; 1500-1690
0.3%; Below 1500 0:
https://admission.princeton.edu/applyingforadmission/admission-statistics.
Selectivity
Acceptance rate:
Fall 2012: 7.85% / 2013:
7.40% / 2014:
7.44% / 2015:
7.138%
(5th)
Yield rate (of
accepted students who enroll) Fall 2014 (C2018): 66% / Fall 2015
(C2019):
67.7%
(4th)
Selectivity index
(acceptance ÷ yield: the lower the score, the more desirable): .105
(5th)
Net Price (total
expenses – grant/scholarship aid)
Net price
average
2013-14 (from NCES) for beginning
undergrads receiving any financial aid: $19,235
(4th)
Net price
average
2014-15 (from NCES) for beginning
undergrads receiving any financial aid: $18,176 (2nd)
Net price
average
2014-15 (from CDS) for beginning undergrads…: $15,825
(1st)
(total costs
$59,940 - average need-based scholarship $44,115); and for
all undergrads: $17,843
(1st)
($59,940 - $42,097). [First-place ranking is in a
list where Harvard's data is not yet available.]
Net price
average
2015-16 (from CDS) for beginning undergrads…: $15,902
(1st)
(total costs
$62,110 - average need-based scholarship $46,208); and for
all undergrads: $17,220
(1st)
($62,110 - $44,890). [First-place ranking is in a
list where Harvard's data is not yet available.]
By income (2013-14):
$0 – $30,000: $3980 (5th) / $30,001 – $48,000: $4356
(3rd) /
$48,001 – $75,000: $6296
(1st)
/ $75,001 – $110,000: $17,317 (4th)
By income (2014-15):
$0 – $30,000: $3736 (3rd) / $30,001 – $48,000: $5433
(4th) /
$48,001 – $75,000: $7364
(3rd)
/ $75,001 – $110,000: $18,650 (7th)
By income
(2015-16): (assessed by deducting the grant amount from the
total cost of $61,160) $0-$65,000: $3460 / $65,000-$85,000:
$7760 / $85,000-$100,000: $10,860 / $100,000 - $120,000:
$13,760
No parental contribution expected
for families making less than $60,000. The only payment
expected is from the student’s summer earnings, part-time
employment, and any savings the student may have.
Free tuition for families making less than
$140,000. Those making between $60,000
and $120,000 only pay a percentage of room and board. The
average aid grant covers 100% of tuition and then some.
Princeton offers
no-loan financial aid packages to all
students who receive financial aid. Princeton is the
original no-loan college/university. In 2001 it announced that
loans would no longer be a part of any financial aid package;
that scholarship or grant money would replace loans.
Debt at Graduation (incl. rank among the GCR top
133) and Default Rates
Average student debt at graduation
C2014: $6600 (1st
lowest) / C2015: $8577 (1st
lowest)
Percentage of
graduates with debt:
C2014:
17% (2nd
lowest) / C2015: 16%
(1st
lowest)
Student loan default rate
2010: 2.7% / 2011: 2.3% / 2012: 2.4% / 2013: .9% [4-yr
avg.:
2.08%; 3-yr avg: 1.87%]
Graduation Rates, Student Enrollment,
Student/Faculty Ratio, Endowment
1st-year retention
rate (2014-15): 97.4% (11th,
tied)
4- & 6-year grad rate (began Fall 2009):
89.7%
(6th)
/ 96.8%
(2nd)
Entering class size:
C2019: 1317 (C2018: 1314);
Student pop.: 8,138 (5,402 undergrad)
Student to faculty ratio
(2015-16): 5 to 1 (2nd)
Endowment
(2016):
$22.15 billion (4th
in the US*, possibly in the world**;
in the US 1st
per student, 3rd
per undergrad-only)
*Fifth if one counts
the entire University of Texas System (endowment of $24.2
billion), which includes not only the flagship institution of
UTexas Austin but also 14 educational institutions (8 academic
universities and 6 health institutions) with a total enrollment
of 216,000 students (50,950 of these are at UTexas Austin). I
don't think that is a fair comparison so I don't count it.
Single institutions should be compared with single institutions.
One article stated that the University of Texas at Austin
gets about 45% of the total UTexas-System endowment so a rough
estimate of UTexas Austin’s endowment in 2016 is $10.89 billion.
US News lists UTexas-Austin’s 2015 endowment at $3.342 billion.
**Depending on the
2015 endowment of King Abdullah University of Science and
Technology in Saudi Arabia, which in 2013 had a ballpark $20
billion.
African American Representation as a Measure of
Diversity
Average number
(and %) per class over 4 years, *no TOMR (Fall 2015):
100* (7.60%)
(9th
in GCR)
Number (*
= excl. those of TOMR): C2019:
89*; C2018:
105*; C2017:
105*; C2016:
101*
# National Achievement Scholarship Winners
(2014): 28
Earning Potential
PayScale Salary 2016-17:
Early career (0-5 years of employment): $65,700;
Mid-career (10+ years): $131,000 (tied
for 3rd)
World Rankings
The
Times Higher Education World University Rankings
(UK) 2016-17: 7
The Times Higher Education World
Reputation Rankings (UK) 2016: 7
QS World University Rankings
(UK) 2016/17: 11
US News Best Global Universities Rankings
2016: 8
Academic Ranking of World Universities
(Shanghai) 2016: 6
Center for World University Rankings
(Saudi Arabia) 2016: 9
Composite Score: 48
(7th
in the world, behind Harvard, Stanford, MIT, Cambridge,
Oxford, Caltech)
FIRE Speech Code Rating (Green:
protects; Yellow: may
restrict;
Red: clearly restricts)
Princeton
University has been given the speech
code rating Red. A red light
university has at least one policy
that both clearly and substantially
restricts freedom of speech. Read
more
here.
“Campus
Pride” Index
Rating:
5 out of 5 stars
This is an
overall indicator of an
institution’s zealous promotion of
an “LGBTQ” agenda to the detriment
of any who have moral qualms about
such an agenda, through coercive
indoctrination, active “diversity”
recruitment, special resourcing,
sanctions, and slander of those who
support a male-female foundation for
sexual unions as “hateful, ignorant,
homophobic bigots” on a par with
racists. For
moderate-to-conservative students it
represents the greatest threat to
their freedom of speech and
association, faith and religious
liberty, and due process at this
institution. Applicants may still
thrive in this oppressive
environment, off-set by association
with like-minded persons, but should
be aware of the risks before
applying.
3.
Stanford University,
Stanford, CA

"Stanford
University campus from above". Licensed under CC BY-SA 3.0 via
Wikimedia Commons - https://commons.wikimedia.org/wiki/File:Stanford_University_campus_from_above.jpg#/media/File:Stanford_University_campus_from_above.jpg
Rankings:
US News (NU) 5t +
College Choice (NU)
4 × 2 = 18; plus…
Forbes 1
WSJ/THE
1
Money 10
College Factual 5
College Raptor
4
Kiplinger 20
Niche 1
PayScale ROI 4
Total, with unranked or worst (outlier) score dropped, then full
score: 43
(64)
The highest-ranked
non-Ivy school, Stanford's ratings are quite impressive.
In three of the rankings lists, Stanford is rated no. 1 (Forbes,
up slightly from last year's third; Wall St. Journal/Times
Higher Education; and
Niche, same as 2016's and 2015's) and in five more
it is rated fourth (College Choice for national
universities; College Raptor, same as last year; and
PayScale ROI, down slightly from last year's third) or
fifth (US News for national universities and USA
Today's College Factual, both down slightly from last
year's fourth). Its fourth-place rank in
PayScale ROI is highest among the non-tech schools. Its
two lowest rankings are tenth (Money, down
significantly from last year's first-place rank; what happened
in one year?) and a puzzling
twentieth
(Kiplinger, a list that emphasizes affordability; up
slightly from 2016's twenty-first and same as 2015's twentieth;
perhaps relatively low rating due to Stanford's twenty-fifth
place student debt rank, in addition to relatively weak
graduation rates). US News also ranks Stanford #10 in
Best Undergraduate Teaching among National Universities. In the GCR composite list of the top six
world rankings it averages second in the
world, behind only Harvard.
A case could be made for
ranking Stanford just ahead of Princeton this year (last year
the ranking of Princeton and Stanford was reversed), or at least
in a tie, since it edges out Princeton in six of the ten lists.
However, Princeton has the better overall score: 34 (43)
compared to Stanford's 43 (64). At the same time, a case could
be made for ranking Yale ahead of Stanford, or at least in a
tie, since it edges out Stanford in five of the nine lists and
bests Stanford by one point when the lowest score is dropped
(but lags behind by two points when all rankings are considered:
42 [66]).
Stanford University
doesn't take kindly to the condescending title of “the Harvard
of the West” (rather, Harvard is “the Stanford of the East” they
would argue). It dominates the Western educational landscape in
a way that Harvard cannot dominate the eastern educational
landscape, given the plethora of top-rated eastern
establishments. Aside from the small seventh-place Caltech
(which competes with Stanford only in math and the sciences),
Stanford’s closest rival in the entire West is geographically
distant Rice University (twelfth) and on the West Coast Pomona
(fifteenth), UCal Berkeley (twenty-second), Harvey Mudd
(twenty-third), UCLA (thirty-sixth), Claremont McKenna
(thirty-seventh), and USC (forty-eighth). In other words,
Stanford has only six competitors on the West Coast in the GCR
Top 50, just half of which are in the Top 25 and only one of
which is in the Top 15. This and the beautiful weather help to
explain why Stanford is ranked as the most desirable school
in the country to attend, at least as indicated by its lowest
acceptance rate, highest yield, and thus best selectivity index,
edging out Harvard slightly (which gets about 7500 fewer
applications than Stanford for an entering class only 60
students smaller).
As for affordability,
Stanford ranked an impressive sixth in lowest average net
price
among the top 133 GCR schools for beginning undergrads
receiving any financial aid in 2014-15 (third in
2013-14). This ranking does not factor in private outside
scholarships; factored in, Stanford still ranks sixth (but stats
not available for Harvard and Columbia). Broken down into
parental salary levels, in 2014-15 for beginning undergrads it
ranked a truly impressive second for incomes $0-$30,000
(2013-14: third), first for $30,001-$48,000
(2013-14: fifth), second for $48,001-$75,000
(2013-14: sixth), and
second for $75,001-$110,000 (2013-14: eighth).
For
all
undergrads receiving any financial aid in 2014-15
(compiled from CDSs that factor in private outside scholarships)
it ranked an impressive fifth (stats not available for
Harvard and Columbia). Stanford's average student loan at
graduation for that portion of the Class of 2015 taking out
any loans was a surprising thirty-eighth lowest among the
GCR top 139 schools; the percentage of students graduating
with debt was the third lowest (4-way tie). Stanford
expects
no parental contribution for families making less than
$65,000, offers free tuition for families earning less
than $125,000, and offers no-loan financial aid packages
for all students who receive financial aid.
There isn’t much that
Stanford doesn’t do well in, though it is particularly
exceptional (top 6) in its student selectivity (noted above),
first-year retention rate (6-way tie for third), endowment
(third in the US and third or fourth in the world; fourth
both per undergrad and per undergrad + grad student), and
student-to-faculty ratio (perhaps 5-way tie
for fifth, though the figures are disputed). It is also
strong (seventh to tenth) in its PayScale
Mid-Career rating (fifth), test scores (SAT:
ninth
without the Writing component, tied for tenth
with it; ACT: 5-way tie for tenth), and
percentage of African-American students (only
thirty-eighth, a point-and-a-half off of Princeton’s Ivy
League high but vastly higher than California schools
generally). Areas where
it underperforms significantly in
relation to its exalted overall rank are its 6-year
graduation rate (twenty-second) and above all its relatively
dismal 4-year graduation rate (eighty-fourth).
Stanford gets a so-so
‘yellow light’ rating from FIRE for having at least one
ambiguous speech-code policy that encourages administrative
abuse and arbitrary application.” Its selection by Princeton
Review as one of the “Top 20 LGBTQ-Friendly Colleges and
Universities in 2015” suggests oppressive conditions for
students who adhere to a male-female foundation for marriage. An
example of such is the 2014 decision by Stanford’s Graduate
Student Council, at the behest of LGBT campus groups, to
withdraw funding from the Catholic Anscombe Society for a
conference on traditional/natural marriage, requiring them to
pay $5,600 for “security costs” in order to guard against
the threat of lawless behavior posed by none other than LGBT
activists. Funds were apparently
“found” after the Society protested and FIRE got involved.
Stanford’s Dean for Religious Life, Jane Shaw, is
a lesbian activist
who describes herself as “not very churchy as a person” and
advocates that churches should “certainly not convert” anyone,
“not even necessarily to do religion all the time.”
Based on political donations of the people who work there,
Stanford University is the 234th
most liberal university out of 446 (7.6 Liberal;
CrowdPac). This is the
forty-fourth most liberal school among the 84 schools of
the GCR Top 133 that Crowdpac examines.
Test scores (Fall
2015 / C2019
enrolled students)
Mid-50% (25th
-75th percentile): SAT CR 690-780, M 700-800, W
690-780, ACT 31-35
Average: CR+M:
1485 (avg. 742.5), ranked 9th;
CR+M+W:
2220
(avg. 740), ranked 10th;
ACT
33, ranked 10th
(5-way tie)
Percent submitted SAT/ACT scores:
80%/51% (2014: 86%/39%)
Selectivity
Acceptance rate: Fall 2012:
6.61% / 2013: 5.69%
/ 2014: 5.087% / 2015: 5.036% (1st)
Yield
rate (of accepted students who enroll) Fall 2014 (C2018):
78.23% / Fall 2015 (C2019):
80.37
(1st)
Selectivity index (acceptance ÷ yield:
the lower the score the more desirable):
.0627 (1st)
Net Price (total
expenses – grant/scholarship aid)
Net price
average
2013-14 (from NCES) for beginning
undergrads receiving any financial aid: $18,552 (3rd)
Net price
average
2014-15 (from NCES) for beginning
undergrads receiving any financial aid: $19,770 (6th)
Net price
average
2014-15 (from CDS) for beginning undergrads…: $19,597
(6th) (total costs
$62,888 - average need-based scholarship $43,291); and for
all undergrads: $19,721 (5th)
($62,888 - $43,167).
By income (2013-14):
$0 - $30,000: $3441 (3rd) / $30,001 – $48,000: $5479
(5th) / $48,001 – $75,000: $8176 (6th)
/ $75,001 – $110,000: $18,812 (8th)
By income (2014-15):
$0 - $30,000: $2457 (2nd) / $30,001 – $48,000: $2548
(1st) / $48,001 – $75,000: $6964 (2nd)
/
$75,001 – $110,000: $14,841 (2nd)
No parental contribution expected
for families making less than $65,000. The only payment
expected is from the student’s summer earnings, part-time
employment, and any savings the student may have. Tuition is
free for families earning less than $125,000. Stanford
offers
no-loan financial aid packages for all students who receive
financial aid.
Debt at Graduation (incl. rank among the GCR top
133) and Default Rates
Average student debt at graduation
C2014: $19,230 (25th
lowest) / C2015: $21,238 (38th
lowest)
Percentage of
graduates with debt:
C2014:
23% (3rd
lowest, tie) / C2015: 22%
(3rd
lowest, 4-way tie)
Student loan default rate
2010: .7% / 2011: 1% / 2012: .8% / 2013: .7% [4-yr
avg.: .8%; 3-yr avg: .833%]
Graduation Rates, Student Enrollment,
Student/Faculty Ratio, Endowment
1st-year retention
rate (2014-15): 98% (6-way tie
for
3rd)
4- & 6-year grad rate (began Fall 2009):
75% (84th, tied)
/ 93% (22nd,
tied)
Entering class size:
C2019: 1720 (C2018: 1678);
Student pop. C2019: 16,770 (6999
undergrad)
Student to faculty ratio:
6 to 1* (5-way tie for 4th)
*Stanford’s
Common Data Set for 2015-16 has a ratio of 4.4 to 1.
However,
Stanford adds an asterisk noting (in tension with the
government’s Common Data Set expectations) inclusion of
faculty in graduate schools if they taught undergraduates
(“exclude … faculty … in stand-alone graduate or
professional programs … in which faculty teach virtually
only graduate level students”), research faculty (exclude
those not “full-time equivalent instructional faculty”), and
lecturers and instructors who may have taught part-time (“Do
not count undergraduate or graduate student teaching
assistants as faculty”). I arrived at the ratio of 6 to 1 by
subtracting from the 1589 full-time instructional faculty
the 416 who teach virtually only graduate students, then
dividing the 6999 total undergraduate population by this
number. Inexplicably, the government's
NCES College Navigator gives a ratio of
10 to 1 for 2014-15.
Endowment
(2016):
$22.398 billion (3rd
in the US,* possibly the world**; in the US 4th
both per student and per undergrad-only)
*Fourth if one
counts the entire University of Texas System (endowment of
$24.2 billion), which includes not only the flagship
institution of UTexas Austin but also 14 educational
institutions (8 academic universities and 6 health
institutions) with a total enrollment of 216,000 students
(50,950 of these are at UTexas Austin). I don't think that
is a fair comparison so I don't count it. Single
institutions should be compared with single institutions.
One article stated that the University of Texas at
Austin gets about 45% of the total UTexas-System endowment
so a rough estimate of UTexas Austin’s endowment in 2016 is
$10.89 billion.
US News lists UTexas-Austin’s 2015 endowment at $3.342
billion.
**Depending on
the 2015 endowment of King Abdullah University of Science
and Technology in Saudi Arabia, which in 2013 had a ballpark
$20 billion.
African American Representation as a Measure of
Diversity
Average number
(and %) per class, *no TOMR (Fall 2015): 106*
(6.08%)
(38th in GCR)
Number, incl. TOMR: C2019:
168
(107*); C2018: 179 (101*); C2017: 97*; C2016: 142 (92*)
For Stanford
C2019 AfrA 9.7% of the whole entering class includes
Internationals (168; incl. multi-):
http://facts.stanford.edu/academics/class-of-2019-profile;
for C2018 10.6% (179).
http://facts.stanford.edu/academics/class-of-2018-profile.
# National Achievement Scholarship Winners
(2014): 61
Earning Potential
PayScale Salary 2016-17:
Early career (0-5 years of employment): $70,800;
Mid-career (10+ years): $127,000 (5th)
The
Times Higher Education World University Rankings (UK)
2016-17: 3
The Times Higher Education World Reputation
Rankings (UK) 2016: 3
QS World University Rankings
(UK) 2016/17: 2
US News Best Global Universities Rankings
2017: 3
Academic Ranking of World Universities
(Shanghai) 2016: 2
Center for World University Rankings
(Saudi Arabia) 2016: 2
Composite Score: 15 (2nd
in the world, behind Harvard)
FIRE Speech Code Rating (Green:
protects; Yellow: may
restrict;
Red: clearly restricts)
 Stanford
University has been given the speech
code rating Yellow. Yellow light
colleges and universities are those
institutions with at least one
ambiguous policy that too easily
encourages administrative abuse and
arbitrary application. Read more
here. Stanford
University has been given the speech
code rating Yellow. Yellow light
colleges and universities are those
institutions with at least one
ambiguous policy that too easily
encourages administrative abuse and
arbitrary application. Read more
here.
Selected by
Princeton Review as fifth
among the
Top 20
“LGBTQ-Friendly” Colleges and
Universities
This is an
overall indicator of an
institution’s zealous promotion of
an “LGBTQ” agenda to the detriment
of any who have moral qualms about
such an agenda, through coercive
indoctrination, active “diversity”
recruitment, special resourcing,
sanctions, and slander of those who
support a male-female foundation for
sexual unions as “hateful, ignorant,
homophobic bigots” on a par with
racists. For
moderate-to-conservative students it
represents the greatest threat to
their freedom of speech and
association, faith and religious
liberty, and due process at this
institution. Applicants may still
thrive in this oppressive
environment, off-set by association
with like-minded persons, but should
be aware of the risks before
applying.
4.
Yale University,
New Haven, CT

Front of Sterling
Memorial Library - "Cross Campus Highsmith" by Carol M.
Highsmith - This image is available from the United States
Library of Congress's Prints and Photographs division under the
digital ID highsm.19228. Licensed under Public Domain via
Wikimedia Commons -
https://commons.wikimedia.org/wiki/File:Cross_Campus_Highsmith.jpg#/media/File:Cross_Campus_Highsmith.jpg
Rankings:
US News (NU) 3t +
College Choice (NU)
1 × 2 = 8; plus…
Forbes 6
WSJ/THE
5
Money 12
College Factual 1
College Raptor
3
Kiplinger 9
Niche 3
PayScale ROI 24
Total, with unranked or worst (outlier) score dropped, then full
score: 51
(75)
Yale is of course the
second oldest university/college in the nation and traditional
rival to Harvard. Two of the lists give Yale a
first-place ranking (College Choice for national
universities and USA Today's College Factual, the latter
for the second year in a row; second in 2015); three
others give it a third-place ranking (US News
for national universities, same as the previous year; College
Raptor, same as last year; and Niche, same as 2016
and up slightly from 2015's fourth). Its other top 10
rankings are fifth (Wall St. Journal/Times Higher
Education), and sixth (Forbes, down slightly
from last year's fifth). Its twelfth-place showing in
Money
(albeit up significantly from last year's tie for twenty-first)
is probably due in part to its surprisingly low twenty-fourth-place
showing in the
PayScale ROI (up from last year's twenty-ninth). Kiplinger
rates it thirteenth (down from 2016's ninth and
markedly so from 2015's second). US News also ranks Yale
#3 in
Best Undergraduate Teaching among National Universities. In the GCR composite list of
the top six world rankings it averages a surprisingly low
(for Yale) eleventh
place (behind, among American schools, Harvard, Stanford, MIT,
Caltech, Princeton, UCal Berkeley, UChicago, and Columbia).
As for affordability,
Yale ranked an impressive third in lowest average net price
among the top 133 GCR schools for beginning undergrads
receiving any financial aid in 2014-15 (fifth in
2013-14). This ranking does not factor in private outside
scholarships; factored in, Yale ranks second (stats not
available for Harvard and Columbia). Broken down into parental
salary levels, in 2014-15 for beginning undergrads it ranked tenth
for incomes $0-$30,000 (2013-14: seventh), seventeenth
for $30,001-$48,000 (2013-14: tenth), an impressive
fourth for $48,001-$75,000 (2013-14: third), and an even
more impressive first for $75,001-$110,000 (2013-14:
third). For all
undergrads receiving any financial aid in 2014-15
(compiled from CDSs that factor in private outside scholarships)
it ranked an impressive third (stats not available for
Harvard and Columbia). As for average net price in 2015-16
(private outside scholarships factored in) it ranked an
impressive second both for beginning undergrads and for
all undergrads (stats not available for
Harvard, Stanford, Columbia, Duke UPenn, and Pomona).
No parental
contribution is expected for families making less than $65,000.
Those making between $65,000 and $200,000 contribute a
percentage of their yearly income on a sliding scale (1% for
just above $65,000 moving toward 20% at $200,000). Yale
offers no-loan financial aid
packages to students whose family earns less than $130,000.
Yale's average student loan at
graduation for that portion of the Class of 2015 taking out
any loans was fifth lowest among the GCR top 139 schools
(behind Princeton, Wellesley, Pomona, and Haverford); the
percentage of students graduating with debt was second lowest
(only one point behind first-place Princeton).
Yale has an amazing
series of second-place stats among the top 133 schools in
the nation:
endowment (absolute, per undergrad, and per all students and
among all US schools), SAT scores, and 6-year graduation rate.
It is in a
3-way tie for the highest first-year retention rate
and a 4-way tie for the fourth lowest student-to-faculty ratio.
As for desirability, it has the fourth lowest acceptance
rate, fifth highest yield rate, and fourth best selectivity
index (acceptance rate over yield rate).
Below its overall
rank but still in the top 16 are its ACT composite score
(tenth highest, 5-way tie)and 4-year graduation rate
(fifteenth; mitigated by the 2nd place 6-year
grad rate).
The only areas where
Yale does not shine are in its African-American student
representation and its PayScale
ratings. Yale is not far off as regards the former, though it
has room for improvement. It is ranked only twenty-fourth
among the top 133 schools, fifteenth among non-Southern schools,
and only fifth among eight Ivies. Yet in terms of percentage it
is only .8% behind Princeton’s high and only 1% behind the
seventh-ranked UNC. The real shocker comes in its
PayScale ratings where it ranks only twenty-ninth
for its 20-year net Return-on-Investment and a paltry
forty-ninth (tie) for Mid-Career Salary.
Yale had a spiraling
incident in Oct.-Nov. 2015 where a residential college professor
and his wife (who also served as a lecturer) were
brutally maligned by numerous students over the relatively
inane matter of questioning whether the University should be
micromanaging students’ lives to the point of telling them what
costumes they could not wear during Halloween. The incident led
many to scratch their heads wondering whether free speech is
still possible at Yale. Eventually the lecturer resigned
although the administration issued
a statement saying that “her teaching is highly valued and
she is welcome to resume teaching anytime at Yale, where freedom
of expression and academic inquiry are the paramount principle
and practice.” FIRE has collected a number of articles on the
matter
here.
Based on political donations of the people who work there, Yale
University is the 208th
most liberal university out of 446 (7.7 Liberal;
CrowdPac). This is the
fortieth most liberal school among the 84 schools of the
GCR Top 133 that Crowdpac examines.
Test scores (Fall
2015 / C2019 enrolled students)
Mid-50% (25th
-75th percentile): SAT CR
720-800, M 710-800, W 710-790; ACT 31-35*
*C2019 SAT
ranges: 760-800: 50.8%R 49.9%M 49.4%W; 700-750: 29.2%R
32.3%M 31.4%W; 600-690: 16.8%R 16.7%M 16.9%W; below 600:
3.2%R 1.2%M 2.4%W.
Yale College Class of 2019 Freshman
Class Profile.
Average: CR+M:
1515 (avg. 757.5), ranked 2nd;
CR+M+W:
2265 (avg. 755), ranked 2nd;
ACT
33, ranked 10th
(5-way tie)
Percent submitted SAT/ACT scores:
74%/45% (2014: 79%/41%; 2013: 81%/35%; 2012: 84%/35%)
Selectivity
Acceptance rate:
Fall 2012: 7.05%
/ 2013: 6.86% / 2014:
6.30% / 2015: 6.727%
(4th)
Yield rate (of
accepted students who enroll) Fall 2014 (C2018): 71.7% / Fall
2015 (C2019): 67.06%
(5th)
Selectivity/Desirability index
(acceptance ÷ yield: the lower the score, the more desirable):
.1003
(4th)
Net Price (total
expenses – grant/scholarship aid)
Net price
average
2013-14 (from NCES) for beginning
undergrads receiving any financial aid: $19,697 (5th)
Net price
average
2014-15 (from NCES) for beginning
undergrads receiving any financial aid: $18,494 (3rd)
Net price average
2014-15 (from CDS) for beginning undergrads…: $17,063
(2nd) (total costs $64,300 - average
need-based scholarship $47,237); and for all undergrads:
$18,590 (3rd) ($64,300 - $45,710).*
*So the 2014-15 Common Data Set; but
elsewhere on Yale’s website the average
need-based scholarship/grant for 2014-15 was $43,230,
which indicates a net price of $21,070. This
likely excludes the external scholarships/grants
(non-federal or state) that the CDS figure includes.)
Net price average
2015-16 (from CDS) for beginning
undergrads…:
$16,341 (2nd) (total costs
$66,700 - average need-based scholarship $50,359); and for
all undergrads: $18,740 (2nd) ($66,700
- $47,960).
By income (2013-14):
$0 - $30,000: $4298 (7th) / $30,001 – $48,000: $6667
(10th) / $48,001 – $75,000: $7293 (3rd)
/ $75,001 – $110,000: $16,609 (3rd)
By income (2014-15):
$0 - $30,000: $6884 (10th) / $30,001 – $48,000: $8344
(17th) / $48,001 – $75,000: $7424 (4th)
/
$75,001 – $110,000: $12,889 (1st)
No parental contribution expected
for families making less than $65,000. The only payment
expected is from the student’s summer earnings, part-time
employment, and any savings the student may have.
“Families earning between $65,000 and $200,000
(with typical assets) annually contribute a percentage of their
yearly income towards their child’s Yale education, on a sliding
scale that begins at 1% just above $65,000 and moves toward 20%
at the $200,000 level.” Yale offers
no-loan financial aid
packages to students who receive financial aid (except for those
whose family earns $130,000 or more).
Debt at Graduation (incl. rank among the GCR top
133) and Default Rates
Average student debt at graduation
C2014: $14,853 (7th
lowest) / C2015: $15,521 (5th
lowest)
Percentage of
graduates with debt:
C2014: 16%
(1st
lowest) / C2015: 17%
(2nd
lowest)
Student loan default rate
2010: 1.9% / 2011: .9% / 2012: .6% / 2013: .6% [4-yr
avg.: 1%; 3-yr avg:
.7%]
Graduation Rates, Student Enrollment,
Student/Faculty Ratio, Endowment
1st-year retention
rate (2014-15): 99% (3-way
tie for 1st)
4- & 6-year grad
rate (began Fall
2008): 87.74%
(17th) / 96.78% (2nd,
tied)
Entering class size:
C2019: 1364 (C2018: 1361);
Student pop.:
12,336 (5,477 undergraduate)
Student to faculty ratio:
6 to 1
Endowment
(2016):
$25.41 billion (2nd
in the US and possibly in the world*; in the US 2nd
in both endowment per student and endowment per undergrad-only)
**Depending on the
2015 endowment of King Abdullah University of Science and
Technology in Saudi Arabia, which in 2013 had $20 billion.
African American Representation as a Measure of
Diversity
Average number
(and %) per average class size over 4
undergrad classes,
*no TOMR (Fall 2015): 94*/1382 (6.80% in
GCR)
Number, incl.
those of TOMR:2
C2019: 1361
(96*); C2018: 133 (87*); C2017: 94*; C2016: 122 (98*)
# National Achievement Scholarship Winners
(2014): 57
1 C2019
African American 10% (incl. multi-):
Yale College Class of 2019 Freshman Class
Profile. Categories do not add up to 100% because 19%
of freshmen indicated two or more ethnicities and are therefore
counted in more than one category.
Earning Potential
PayScale Salary 2016-17:
Early career (0-5 years of employment): $60,800;
Mid-career (10+ years): $102,000 (tied for 49th)
The
Times Higher Education World University Rankings (UK)
2016-17: 12
The Times Higher Education World Reputation
Rankings (UK) 2016: 8
QS World University Rankings
(UK) 2016/17: 15
US News Best Global Universities Rankings
2017: 14
Academic Ranking of World Universities
(Shanghai) 2016: 11
Center for World University Rankings
(Saudi Arabia) 2016: 10
Composite Score: 70
(11th
in the world, behind Princeton and the 6 ahead of Princeton
[q.v.], plus UChicago, UCal-Berkeley, and Columbia)
FIRE Speech Code Rating (Green:
protects; Yellow: may
restrict;
Red: clearly restricts)
Yale
University has been given the speech
code rating Yellow. Yellow light
colleges and universities are those
institutions with at least one
ambiguous policy that too easily
encourages administrative abuse and
arbitrary application. Read more
here.
Selected by
Princeton Review as twentieth
among the
Top 20 “LGBTQ-Friendly” Colleges and
Universities
This is an
overall indicator of an
institution’s zealous promotion of
an “LGBTQ” agenda to the detriment
of any who have moral qualms about
such an agenda, through coercive
indoctrination, active “diversity”
recruitment, special resourcing,
sanctions, and slander of those who
support a male-female foundation for
sexual unions as “hateful, ignorant,
homophobic bigots” on a par with
racists. For
moderate-to-conservative students it
represents the greatest threat to
their freedom of speech and
association, faith and religious
liberty, and due process at this
institution. Applicants may still
thrive in this oppressive
environment, off-set by association
with like-minded persons, but should
be aware of the risks before
applying.
5.
Massachusetts Institute of Technology (MIT),
Cambridge, MA
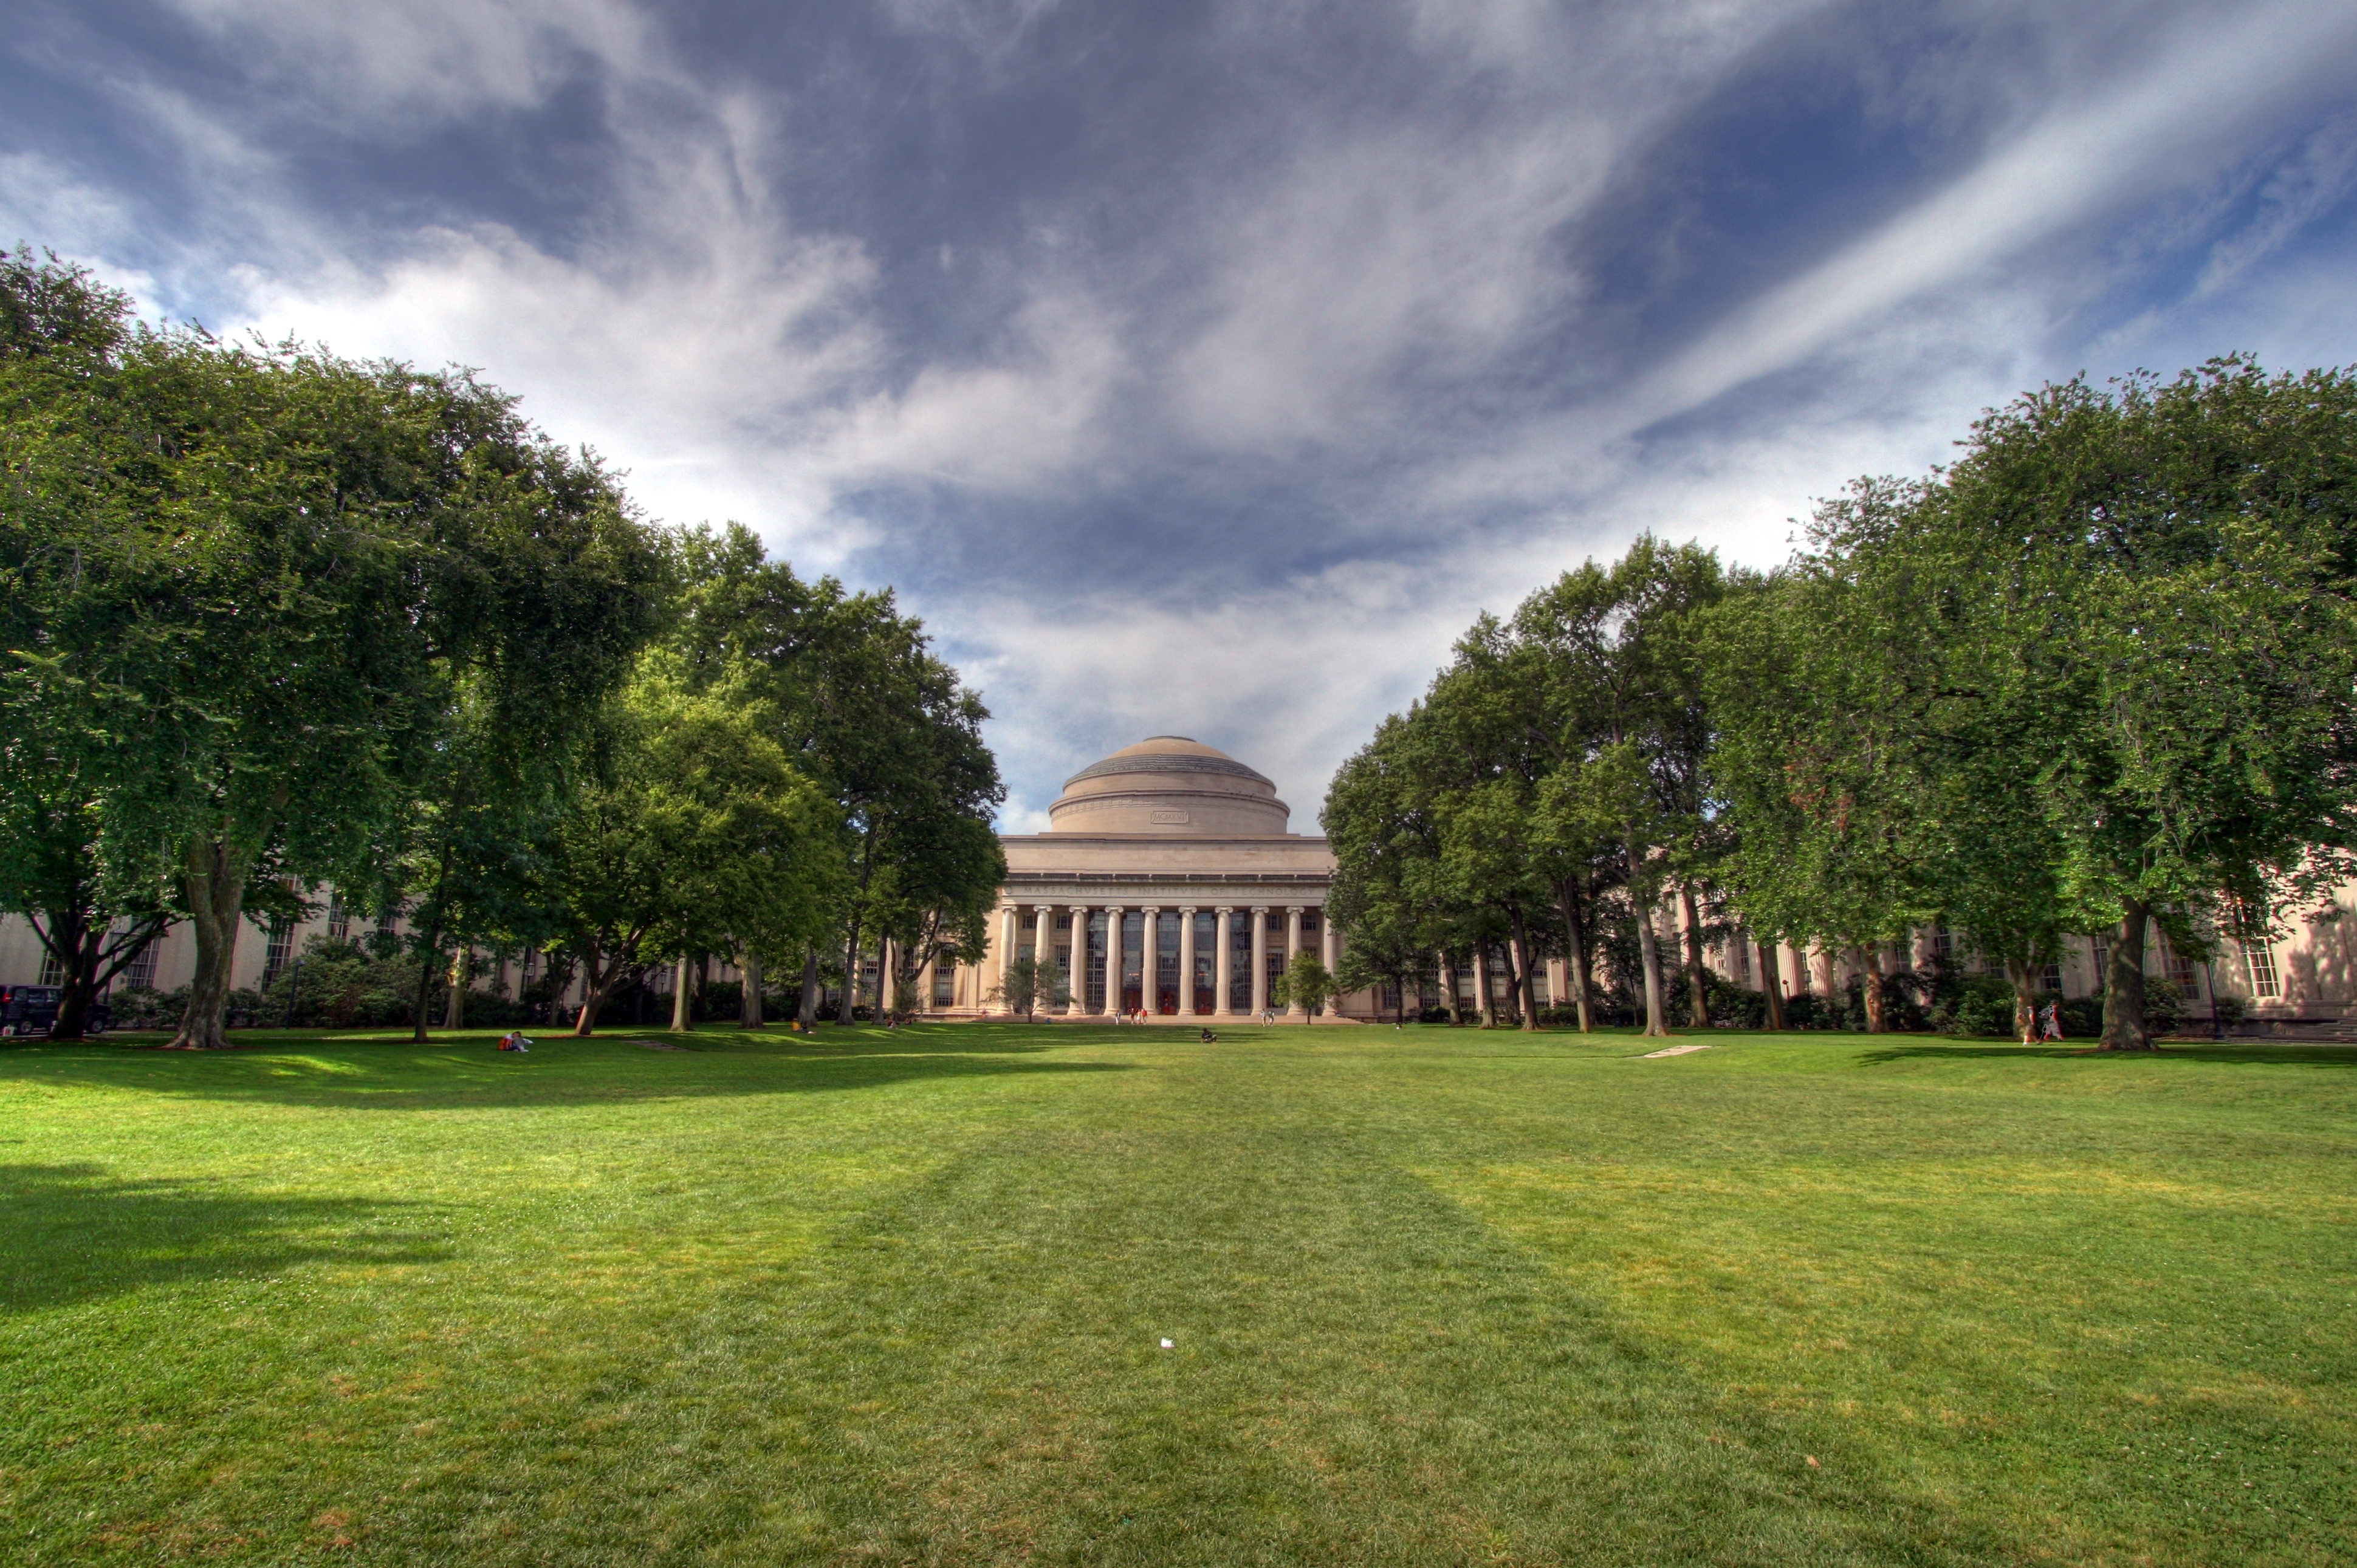
"HDR
image of the Great Dome and Killian Court at MIT"
by Madcoverboy - Own work. Licensed under CC
BY-SA 3.0 via Wikimedia Commons -https://commons.wikimedia.org/wiki/Category:Massachusetts_Institute_of_Technology#/media/File:MIT_Killian_Court.jpg
Rankings:
US News (NU) 7 +
College Choice (NU)
3 × 2 = 20; plus…
Forbes 5
WSJ/THE
2
Money 11
College Factual 12
College Raptor
5
Kiplinger
22
Niche 2
PayScale ROI 1
Total, with unranked or worst (outlier) score dropped, then full
score: 63
(80)
That other powerhouse
school in Cambridge, MA, besides Harvard is this prince among
engineering and science schools (where
72% have as their first major engineering and 23% science;
for the rest there is a smattering of Humanities, Arts, and
Social Sciences; Architecture; and Management).
College Board, counting first and second majors, divvies the
most common majors up as follows: engineering 35%, computer and
information sciences 22%, math 10%, biology 9%, and physical
scienes 9%.
MIT is ranked
once first
by PayScale ROI (last year sixth), twice second by
Wall St. Journal/Times Higher Education
and Niche,
once third by College Choice (for national
universities), twice fifth by Forbes (last year
tenth) and College Raptor (same as last year), and once
each seventh by
US News
(for national universities; same as previous year), eleventh
by
Money
(last year third), twelfth by College Factual
(down slightly from last year's eleventh; fifth in 2015), and
twenty-second by Kiplinger
(down from 2016's and 2015's seventeenth). It also averages
third in
the GCR composite of six world rankings lists (which
values highly the number of articles published by faculty,
particularly in top science journals), behind only Harvard and
Stanford (first in QS World University Rankings, second
in US News Global Universities Rankings and The Times
Higher Education World Reputation Rankings, third in the
Center for World University Rankings, and fifth in The
Times Higher Education World University Rankings and the
Academic Ranking of World Universities).
As for affordability,
MIT ranked twentieth in lowest average net price among
the top 133 GCR schools for beginning undergrads
receiving any financial aid
in 2014-15 (twenty-first in 2013-14). This ranking does
not factor in private outside scholarships; factored in, MIT
ranks nineteenth (stats not available for Harvard and Columbia).
Broken down into parental salary levels, in 2014-15 for
beginning undergrads it ranked thirty-second for incomes
$0-$30,000 (2013-14: twelfth),
fourteenth for $30,001-$48,000 (2013-14: seventeenth),
sixteenth for $48,001-$75,000 (2013-14: twelfth), and
ninth for $75,001-$110,000
(2013-14: tenth). For all undergrads
receiving any financial aid in 2014-15 (compiled from
CDSs that factor in private outside scholarships) it ranked
ninth (stats not available for Harvard and Columbia). MIT's
average student loan at graduation
for that portion of the Class of 2015 taking out any loans was a
surprisingly poor fifty-seventh among the GCR top 139
schools; the percentage of students graduating with debt was
the sixteenth lowest.
MIT does better than its
overall ranking nationally in three categories: its 3-to-1
student-to-faculty ratio (tied for first with Caltech), its
ACT composite scores for the entering class (tied for
second with Harvey Mudd, just behind Caltech), yield rate
(third, behind Stanford and Harvard), and
first-year retention rate
(6-way tie for third).
At or close to its
overall ranking are its
endowment (fifth) and endowment per undergrad (fifth;
seventh per undergrad + grad), its PayScale Mid-Career
Salary (second), selectivity (desirability) index (sixth),
acceptance rate (sixth), and SAT scores for the entering
class (fifth [tied] and seventh
for without and with the Writing component). MIT’s
worse rankings are for its
4- and 6-year graduation rates (64th and 33rd
respectively) and its African-American student representation
(48th).
Based on political donations of the people who work there, MIT
is the 169th
most liberal university out of 446 (7.9 Liberal;
CrowdPac). This is the
thirtieth most liberal school among the 84 schools of the
GCR Top 133 that Crowdpac examines.
Test scores (Fall
2015 / C2019 enrolled students)
Mid-50% (25th
-75th percentile): SAT CR 680-770, M 750-800, W
690-780, ACT 33-35
Average: CR+M:
1500 (avg. 747.5), ranked 5th (tied);
CR+M+W:
2235 (avg. 745), ranked 7th;
ACT
34, ranked 2nd (tie)
Percent submitted SAT/ACT scores:
80%/47% (2014: 84%/42%; 2013: 85%/40%)
Selectivity
Acceptance rate: Fall 2012:
8.95% / 2013: 8.15%
/ 2014: 7.88% / 2015:
8.298%
(6th among nationally ranked
schools
Yield
rate (of accepted students who enroll) Fall 2014
(C2018): 72% / Fall 2015 (C2019):
72.81%
(3rd)
Selectivity index (acceptance ÷ yield:
the lower the score, the more desirable):
.1140 (6th)
Net Price
(total expenses – grant/scholarship
aid)
Net price
average
2013-14 (from NCES) for beginning
undergrads receiving any financial aid: $23,934 (21st)
Net price
average
2014-15 (from NCES) for beginning
undergrads receiving any financial aid: $23,401 (20th)
Net price
average 2014-15 (from CDS) for beginning
undergrads…:
$22,858 (19th) (total costs
$62,740 - average need-based scholarship $39,882); and for
all undergrads: $22,965 (3-way tie for 9th)
($62,740 - $39,775).
Net price average
2015-16
(from MIT website) for all undergrads:
$28,208* (total costs $64,934 - average “MIT scholarship”
$36,726).
*As a net price this figure may not take into account
the federal and state/local grants and other external
scholarships that the NCES figure for 2013-14 factors.
If so, then the net price for 2015-16 would be about
$3000 less: $25,208.
By income (2013-14):
$0 - $30,000: $6850 (12th) / $30,001 – $48,000: $8419
(17th) /
$48,001 – $75,000: $11,266 (12th) /
$75,001 – $110,000: $19,714
(10th; for additional info using different
income ranges go
here)
By income (2014-15):
$0 - $30,000: $10,513 (32nd) / $30,001 – $48,000:
$8101 (14th) / $48,001 – $75,000: $13,360 (16th)
/ $75,001 – $110,000: $20,075
(9th)
Free Tuition
for families making less than $75,000 (so 32% of undergrads
in 2012-13).
MIT has no provision for eliminating parental
contribution for low-income students.
MIT offers no-loan financial aid packages
to families with income under $75,000 but in 2012
increased the self-help expectation from students (from
full-time summer employment and part-time academic year
work-study) from $2850 in 2008 to $6000 in 2012 (the same amount
expected of all students). All schools with no-loan financial
aid policies expect a certain amount of self-help but it is
usually less (for example, $3500 from freshmen for Princeton,
$4500-5500 for sophomores on).
Debt at
Graduation (incl. rank among the GCR top 133) and Default Rates
Average student debt at graduation
C2014: $19,064 (22nd
lowest) / C2015: $23,485 (57th
lowest)
Percentage of
graduates with debt:
C2014: 40%
(33rd
lowest) / C2015: 32%
(16th
lowest)
Student loan default rate
2010: 1.7% / 2011: 1.7% / 2012: 1.7% / 2013: 1.0%
[4-yr avg.:
1.525%; 3-yr avg: 1.467%]
Graduation Rates, Student Enrollment,
Student/Faculty Ratio, Endowment
1st-year retention
rate (2014-15): 98% (6-way
tie for 3rd)
4- & 6-year grad
rate (began Fall
2009): 81.99%
(64th)
/91.93%
(33rd)
Entering class size:
C2019: 1109 (C2018: 1043);
Student pop.:
11,319 (4,512 undergraduate)
Student to faculty ratio:
3 to 1 (tied for 1st)
Endowment
(2016):
$13.18 billion (5th
in the US* and 6th
in the world; in the US 7th
per student and 5th
per undergrad-only)
*Sixth if one counts
the entire University of Texas System (endowment of $24.2
billion), which includes not only the flagship institution of
UTexas Austin but also 14 educational institutions (8 academic
universities and 6 health institutions) with a total enrollment
of 216,000 students (50,950 of these are at UTexas Austin). I
don't think that is a fair comparison so I don't count it.
Single institutions should be compared with single institutions.
One article stated that the University of Texas at Austin
gets about 45% of the total UTexas-System endowment so a rough
estimate of UTexas Austin’s endowment in 2016 is $10.89 billion.
US News lists UTexas-Austin’s 2015 endowment at $3.342 billion.
African American Representation as a Measure of
Diversity
Average number
(and %) per class over 4 undergrad
classes,
*no TOMR (Fall 2015): 63.5* (5.68%) (48th
in GCR)
Number, incl. those of TOMR:2
C2019:
100 (61*); C2018: 104
(72*); C2017: 52*;
C2016: 91 (65*). Average per class for whole undergrad body as
of 2014-15:
92.
# National Achievement Scholarship Winners
(2014): 43
Earning Potential
PayScale Salary 2016-17:
Early career (0-5 years of employment):
$78,300; Mid-career (10+ years):
$134,000 (2nd)
The
Times Higher Education World University Rankings (UK)
2016-17: 5
The Times Higher Education World Reputation
Rankings (UK) 2016: 2
QS World University Rankings
(UK) 2016/17: 1
US News Best Global Universities Rankings
2017: 2
Academic Ranking of World Universities
(Shanghai) 2016: 5
Center for World University Rankings
(Saudi Arabia) 2016: 3
Composite Score: 18 (3rd
in the world, behind only Harvard and Stanford)
FIRE Speech Code Rating (Green:
protects; Yellow: may
restrict;
Red: clearly restricts)
Massachusetts
Institute of Technology has been given
the speech code rating Yellow. Yellow
light colleges and universities are
those institutions with at least one
ambiguous policy that too easily
encourages administrative abuse and
arbitrary application. Read more
here.
“Campus Pride” Index
Rating:
4.5 out of 5 stars
This is an overall indicator of an
institution’s zealous promotion of an “LGBTQ” agenda to the
detriment of any who have moral qualms about such an agenda,
through coercive indoctrination, active “diversity” recruitment,
special resourcing, sanctions, and slander of those who support
a male-female foundation for sexual unions as “hateful,
ignorant, homophobic bigots” on a par with racists. For
moderate-to-conservative students it represents the greatest
threat to their freedom of speech and association, faith and
religious liberty, and due process at this institution.
Applicants may still thrive in this oppressive environment,
off-set by association with like-minded persons, but should be
aware of the risks before applying.
6.
University of Pennsylvania,
Philadelphia, PA
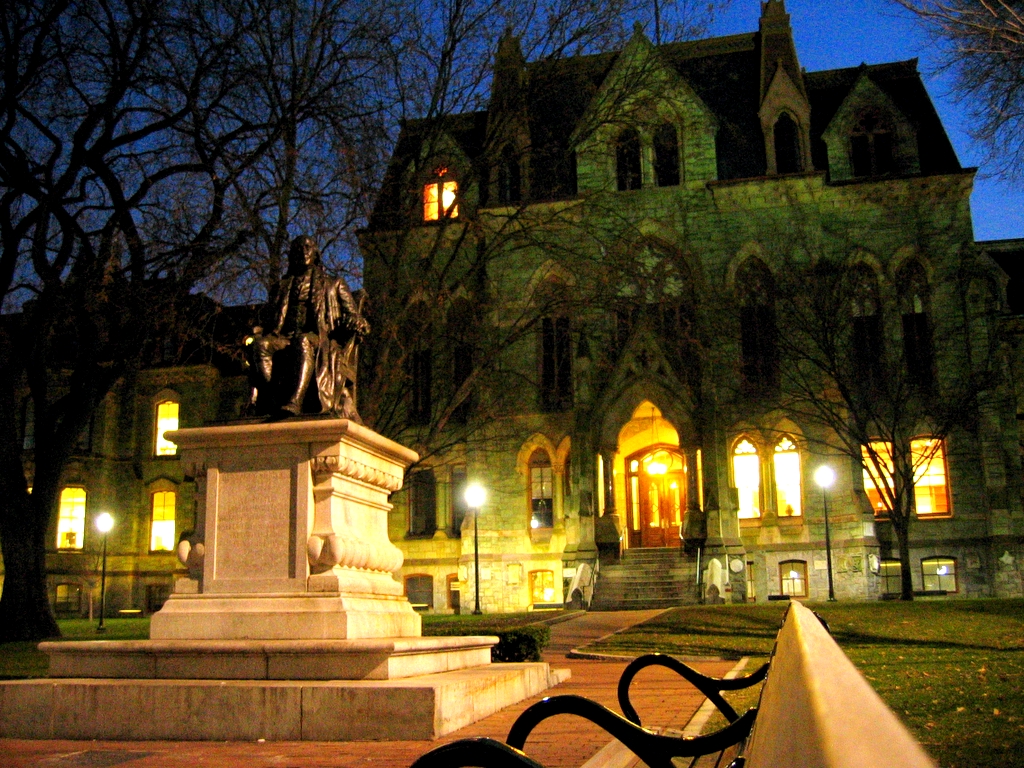
"College
Hall and Ben Franklin Statue" by
Bryan Y. W. Shin
- Own work. Licensed under CC BY-SA 3.0 via Wikimedia Commons -
https://commons.wikimedia.org/wiki/Category:College_Hall_(University_of_Pennsylvania)#/media/File:College_Hall_and_Ben_Franklin_Statue.jpg
Rankings:
US News (NU) 8 +
College Choice (NU)
9 × 2 = 34; plus…
Forbes 11
WSJ/THE
4
Money 26
College Factual 3
College Raptor
9
Kiplinger
40
Niche
8
PayScale ROI 9
Total, with unranked or worst (outlier) score dropped, then full
score: 111
(144)
This
second-largest of the Ivies is sometimes confused by the general
public as though it were a public state school like Penn State.
However, there should be no confusing of the fact that UPenn
belongs to the upper echelon of Ivies, behind Harvard,
Princeton, and Yale, in competition with Columbia. With two
exceptions, all of the University of Pennsylvania’s rankings are
between third and eleventh. Its best ratings are third
(USA Today's College Factual, for the second year in a
row; first in 2015), fourth
(Wall St. Journal/Times Higher Education), twice
eighth (US News [up slightly from last year's ninth]
for national universities; and Niche, down slightly from
last year's sixth),
thrice ninth (College Raptor, down slightly from
last year's seventh; College Choice, for national
universities; also PayScale’s Return-on-Investment, last
year sixteenth), and eleventh (Forbes, last year
twelfth). The two exceptions are its twenty-sixth place
ranking in Money
(last year twelfth) and its fortieth place rank in
Kiplinger
(suggesting an issue with net price and financial aid; down
from 2016's thirty-third and 2015's twenty-sixth). In the GCR
composite list of the top six
world rankings it is thirteenth (bested by 10
other American schools, including four other Ivy League schools
[Harvard, Princeton, Columbia, Yale], plus Stanford, MIT,
Caltech, UCal Berkeley, UChicago, UCLA).
In terms of affordability for the past several years
UPenn has averaged twenty-second in net price when different
income levels are factored in and twenty-fourth when they are
not. UPenn's average student loan at graduation
for that portion of the Class of 2015 taking out any loans was
a disappointing
eightieth among the GCR top 133 schools; the percentage
of students graduating with debt was eleventh
lowest (tie). UPenn does not have a provision for eliminating
parental contribution from financial aid packages for low income
students but it does have a no-loan
financial aid package for students who qualify for
financial aid.
Areas where UPenn has a particularly strong
rating include: (1) its fifth place for
lowest student-faculty ratio (5.8 to 1); (2) its
third-place 7-way tie for the highest freshman retention rate
(98%);
and (3) its fifth-highest yield rate (67.8%). It is also (4) the only school in the GCR top 20 to
get FIRE’s top green-light rating for not penalizing free
speech in its speech codes.
Areas where its rating
is generally commensurate with its overall place rank are: (1)
its seventh-highest 6-year graduation rate (95.26%); (2) its
eighth-place selectivity (desirability) index; (3) its
seventh-highest endowment in the US ($10.7 billion: ninth in the
world, seventh in the US; but twenty-fifth
per student and fourteenth per undergrad-only); (4) its
tenth-lowest acceptance rate (9.4%); (5) its
eighth-highest (tie) PayScale Mid-Career Salary rating
among all schools ($124,000); (6) its ninth-highest PayScale Return-on-Investment rating
among all schools.
Areas where it is
weakest
relative to its overall rank (though still high overall) are (1) its
thirteenth-fifteenth place rankings for its C2019 test scores
(1465/2200/32.5); (2) its fourteenth-highest African-American representation
among undergrads (7.35%, though bested in the Ivy League only by
Princeton); and (3) its forty-first-highest 4-year
graduation rate (84.6%).
Sadly, UPenn boasts one
of the most extreme campus sexual politics, with a
“perfect” “top-25” 5 out of 5 stars from “Campus Pride.”
Based on political donations of the people who work there, the
University of Pennsylvania is the 264th
most liberal university out of 446 (7.3 Liberal;
CrowdPac). This is the
fifty-second most liberal school among the 84 schools of
the GCR Top 133 that Crowdpac examines.
Test scores of enrolled students
Fall 2016 (C2020):
Mid-50%
(25th
-75th percentile):
SAT CR 680-770, M 700-800, W
690-780; Essay 8-10; ACT 32-35
SAT
Average: CR+M:
1475 (avg. 737.5), ranked 9th +
CR+M+W: 2210
(avg. 736.7), ranked 7th +
ACT
composite average:
33.5, ranked 2nd (7-way tie)
Percent
submitted SAT/ACT scores: ??%/??% [not reported]
Fall 2015 (C2019):
Mid-50%
(25th
-75th percentile):
SAT CR 680-780, M 690-780, W
690-780; ACT 31-34
SAT Average: CR+M:
1465 (avg. 732.5), ranked 15th (tied)
CR+M+W: 2200 (avg. 733.3), ranked 13th
(4-way tie)
ACT composite average: 32.5,
ranked 15th
(8-way tie)
Percent
submitted SAT/ACT scores:
71%/44% (2014: 77%/40%; 2013: 79%/38%)
Selectivity
Acceptance rate: Fall 2012: 12.61% /
2013: 12.24% / 2014:
10.37% /
2015:
10.16%
(10th) / 2016: 9.44% (10th among
GCR top 133
schools)
Yield rate
(of accepted students who enroll) Fall 2014:
65.22% / 2015:
64.30%
(6th) / 2016: 67.80%
(5th)
Selectivity index (acceptance ÷ yield:
the lower the score, the more desirable): Fall 2015: .1580 (8th)
/ .1392 (8th)
Net Price
(total expenses – grant/scholarship
aid)
Net price
average
2015-16 (from CDS) for beginning undergrads…: $22,315 (17th)
(total costs
$68,026 - average need-based scholarship $?); and for all
undergrads: $24,127 (20th)
($68,026 - $?).
Net price
average
2014-15 (from NCES) for
beginning undergrads receiving any financial aid: $25,356
(33rd)
Net price
average
2014-15 (from CDS) for beginning undergrads…: $23,482
(23rd) (total costs
$65,632 - average need-based scholarship $42,150); and for
all undergrads: $24,034 (21st)
($65,632 - $41,598).
Net price
average
2013-14 (from NCES) for
beginning undergrads receiving any financial aid: $24,206
(23rd)
By income
(2014-15): $0 - $30,000: $10,674 (33rd) / $30,001
– $48,000: $9761 (25th) / $48,001 – $75,000:
$14,720 (25th) / $75,001 – $110,000:
$21,476 (15th)
By income
(2013-14): $0 - $30,000: $9148 (21st) / $30,001 –
$48,000: $7842 (13th) / $48,001 – $75,000: $14,451
(21st) / $75,001 – $110,000: $20,622 (13th)
By income (2016-17;
from UPenn website; note total costs
$70,500) "median annual awards": $0 - $39,999: $66,400
[leaving $4100?] / $40,000 - $69,999: $65,290 [leaving
$5,210?] / $70,000 - $99,999: $58,680 [leaving $11,820?] /
$100,000 - 129,999: $42,490 [leaving $28,010?]*
By income (2015-16;
from UPenn website; note total costs
$68,026) "median annual awards": $0 - $39,999: $63,790
[leaving $4336?] / $40,000 - $69,999: $63,500 [leaving
$4526?] / $70,000 - $99,999: $56,770 [leaving $11,256?]*
*Likely that the median annual award includes federal
work-study funds since there is such a disparity between
these figures and the ones obtained via the NCES Navigator site; possibly also
includes summer earnings on
the part of the student.
No provision is made for eliminating parental
contribution from financial aid
packages for low income students. However, there is
an all-grant no-loan policy for all undergraduates
who receive financial aid, making UPenn “the largest school
in the nation to offer” such a deal.
Debt at Graduation (incl. rank among the GCR top
133) and Default Rates
Average student debt at graduation
C2014: $19,442 (27th
lowest) / C2015: $26,157 (80th
lowest)
Percentage of
graduates with debt:
C2014: 36%
(24th
lowest, 3-way tie) / C2015: 28%
(11th
lowest, tie)
Student loan default rate
2010: 1.6% / 2011: 1.3% / 2012: 1.1% / 2013: 1.4%
[4-yr avg.:
1.35%; 3-yr avg: 1.267%]
Graduation Rates, Student Enrollment,
Student/Faculty Ratio, Endowment
1st-year retention rate (2014-15): 98% (7-way
tie for 3rd) / 98% (7-way tie
for 3rd)
4- & 6-year grad rate
(began Fall
2009): 87.05%
(21st)
/ 95.34% (7th);
(began Fall 2010):
84.60% (41st) / 95.26% (7th)
Entering class size:
C2020: 2,491 (C2019: 2,435; C2018: 2425)
Student pop.: (Fall 2016) 21,826
(10,019 undergrad) / (Fall 2015) 21,395 (9726
undergraduate)
Student to faculty ratio
(2016-17): 5.77 to 1 (5th)
Endowment
(2016):
$10.715 billion (7th in
the US*, 9th in the world;
in the US 25th
per student and 14th per undergrad-only)
*Tenth if one counts
system endowments rather than individual universities. The
entire Texas A&M University System endowment of $11.1 billion in
2014 applies to 11 universities with 143,000 students (62,000 of
these are at the flagship Texas A&M University at College
Station). I’m estimating half of the Texas A&M University
System’s endowment for the flagship university at College
Station ($5.55 billion), though admittedly the estimate is based
on nothing more than the number of students in the System who
are not at College Station. Similarly, the University of
Michigan System has a 2015 endowment of
$10.26 billion. The University of Michigan in Ann Arbor
operates satellite campuses in Flint and Dearborn with a
combined student body of 17,500 as compared to the over 43,600
student population at Ann Arbor. Since the student body figure
for the satellite campuses is 28.7% of the whole I deducted a
proportional amount from the system endowment in order to arrive
at an estimated endowment of $7.32 billion for UMichigan at Ann
Arbor.
African American Representation as a Measure of
Diversity
Average number
(and %) per class over 4 undergrad
classes,
*no TOMR (Fall 2016): 172* (7.35%) (14th
in GCR)
Number (* = excl. those of TOMR):
C2020: 201*; C2019:
165*
(272); C2018: 149*
Earning Potential
PayScale Salary 2016-17:
Early career (0-5 years of employment):
$62,200; Mid-career (10+ years): $124,000 (tied for
8th)
The
Times Higher Education World University Rankings
(UK) 2016-17: 13
The Times Higher Education World
Reputation Rankings (UK) 2016: 16
QS World University Rankings
(UK) 2016/17: 18
US News Best Global Universities Rankings
2017: 17t
Academic Ranking of World Universities
(Shanghai) 2016: 18
Center for World University Rankings
(Saudi Arabia) 2016: 14
Composite Score: 96 (13th
in the world, behind Yale and the 10 schools ahead of Yale
[q.v.], plus UCLA)
FIRE Speech Code
Rating (Green:
protects; Yellow:
may restrict;
Red: clearly
restricts)
 University
of Pennsylvania has been given the
speech code rating Green. Green
light institutions are those
colleges and universities whose
policies nominally protect free
speech. Read more
here. University
of Pennsylvania has been given the
speech code rating Green. Green
light institutions are those
colleges and universities whose
policies nominally protect free
speech. Read more
here.
“Campus Pride” Index
Rating as one mark of an oppressive/coercive
environment for conservative students
5 out of 5 stars
Selected as one of the
Top 25 “LGBTQ-Friendly” Colleges &
Universities in 2015
This
is an overall indicator of an institution’s zealous
promotion of an “LGBTQ” agenda to the detriment of any
who have moral qualms about such an agenda, through
coercive indoctrination, active “diversity” recruitment,
special resourcing, sanctions, and slander of those who
support a male-female foundation for sexual unions as
“hateful, ignorant, homophobic bigots” on a par with
racists. For moderate-to-conservative students it
represents the greatest threat to their freedom of
speech and association, faith and religious liberty, and
due process at this institution. Applicants may still
thrive in this oppressive environment, off-set by
association with like-minded persons, but should be
aware of the risks before applying.
Lest any doubt remains about UPenn's extreme sexual
politics, consider this article by the New York
Times: "Generation LGBTQIA" (Jan. 9, 2013):
“Sometimes L.G.B.T.Q.I.A. is not enough. At the University of Pennsylvania last fall, eight freshmen united in the frustration that no campus group represented them. Sure, Penn already had some two dozen gay student groups, including Queer People of Color, Lambda Alliance and J-Bagel, which bills itself as the university’s ‘Jewish L.G.B.T.Q.I.A. Community.’ But none focused on gender identity (the closest, Trans Penn, mostly catered to faculty members and graduate students). Richard Parsons, an 18-year-old transgender male, discovered that when he attended a student mixer called the Gay Affair, sponsored by Penn’s L.G.B.T. Center…. ‘This is the L.G.B.T. Center, and it’s all gay guys.’ Through Facebook, Richard and others started a group called Penn Non-Cis, which is short for ‘non-cisgender.’ For those not fluent in gender-studies speak, ‘cis’ means ‘on the same side as’ and ‘cisgender’ denotes someone whose gender identity matches his or her biology, which describes most of the student body. The group seeks to represent everyone else…. On a brisk Tuesday night in November, about 40 students crowded into the L.G.B.T. Center, a converted 19th-century carriage house, for the group’s inaugural open mike. The organizers had lured students by handing out fliers on campus while barking: ‘Free condoms! Free ChapStick!’
“…‘There’s a really vibrant L.G.B.T. scene,’ Kate Campbell, one of the M.C.’s, began. ‘However, that mostly encompasses the L.G.B. and not too much of the T. So we’re aiming to change that.’ … She explained that being bi-gender is like manifesting both masculine and feminine personas, almost as if one had a ‘detachable penis.’ … In high school, Kate identified as ‘agender’ and used the singular pronoun ‘they’; she now sees her gender as an ‘amorphous blob.’ … ‘While I definitely knew that I liked girls, I didn’t know that I was one,’ Britt said…. She wasn’t ‘trapped in the wrong body,’ as the cliché has it — she just didn’t know which body she wanted.
“…Raised female, Richard [Parsons] grew up in Orlando, Fla., and realized he was transgender in high school… By the time he got to UPenn, he had been binding his breasts for more than two years and had developed back pain. At the open mike, he told a harrowing story about visiting the university health center for numbness and having a panic attack when he was escorted into a women’s changing room. Nevertheless, he praised the university for offering gender-neutral housing. The college’s medical program also covers sexual reassignment surgery… [The University of Pennsylvania] has not always been so forward-thinking [!]; a decade ago, the L.G.B.T. Center (nestled amid fraternity houses) was barely used. But in 2010, the university began reaching out to applicants whose essays raised gay themes.”
7.
California Institute of Technology,
Pasadena, CA

"Robert
A. Milliken Memorial Library — at Caltech, Pasadena. The tallest
building on the Caltech campus" by
Canon vs. nikon - Own work. Licensed under CC BY-SA 3.0 via
Wikimedia Commons -
https://commons.wikimedia.org/wiki/Category:California_Institute_of_Technology_campus#/media/File:Robert_A._Millikan_Memorial_Library_at_Caltech.jpg
Rankings:
US News (NU) 12t + College
Choice (NU) 6 × 2
=
36; plus…
Forbes 39
WSJ/THE
10
Money
24
College Factual 16
College Raptor
7
Kiplinger 19
Niche
16
PayScale ROI 2
Total, with unranked or worst (outlier) score dropped, then full
score: 145
(169)
Caltech is to MIT what
Stanford is to Harvard: a serious western-US contender to a more
established school in the East, here for the title of top tech
school in the country. More than a third of students major in
engineering (36%), followed by physical sciences (22%), computer
& information sciences (18%), biology (13%), and math (11%).
Its top-10 ratings are
second in PayScale's Return on Investment
(second year in a row; MIT is first this year, up from sixth
last year), sixth (College Choice for national
universities), seventh (College Raptor, up from
last year's tenth), and tenth (Wall St. Journal/Times
Higher Education). In six of the ten lists it stands outside
the top ten: twelfth (tie; US News for national
universities, down slightly from last year's tie for tenth),
nineteenth (Kiplinger, down slightly from 2016's
fifteenth and 2015's sixteenth),
twice sixteenth (USA Today's College Factual, up
slightly from last year's seventeenth; and Niche, down
substantially from 2016's seventh), twenty-fourth (Money,
a surprisingly steep drop from last year's fifth), and
thirty-ninth (Forbes, last year thirty-third).
As for affordability,
Caltech ranked sixteenth in lowest average net price among
the top 133 GCR schools for beginning undergrads
receiving any financial aid in 2014-15 (a major
improvement from forty-second in 2013-14). This ranking does not
factor in private outside scholarships; factored in, Caltech
ranks ninth (stats not available for Harvard and Columbia).
Broken down into parental salary levels, in 2014-15 for
beginning undergrads it ranked twenty-eighth for incomes
$0-$30,000 (2013-14: eleventh), fifteenth for $30,001-$48,000
(2013-14: second!), an impressive eighth for $48,001-$75,000
(2013-14: seventh), and a surprisingly high eighty-second for
$75,001-$110,000 (2013-14: eleventh!). For all
undergrads receiving any financial aid in 2014-15
(compiled from CDSs that factor in private outside scholarships)
it ranked fifteenth (stats not available for Harvard and
Columbia). As for average net price in 2015-16 (private
outside scholarships factored in) it ranked thirty-second
for beginning undergrads and eighteenth for all undergrads
(stats not available for
Harvard, Stanford, Duke, Columbia, UPenn, UChicago, Pomona,
Harvey Mudd, Middlebury, Emory, USC, and Carleton).
Caltech's average student loan at graduation
for that portion of the Class of 2015 taking out any loans was
only thirtieth among the GCR top 139 schools (a drastic
drop from its second place showing for the Class of 2014); the
percentage of students graduating with debt was only
thirty-fourth (5-way tie; markedly lower than its 3-way tie
for fifteenth as regards the Class of 2014).
Many of Caltech's other
rankings are quite impressive. Its students have the
highest average standardized test scores in the nation.
For the second year in a row PayScale has given it the no.
2 rank in the nation for return on investment (ROI; MIT
is first this year, up from sixth last year); its
PayScale Mid-Career Salary is fifth. The
student/teacher ratio is an amazing 3-to-1 for this
small school, tied with MIT for the best in
the nation). In standard world rankings lists,
which favor technology and the sciences, Caltech stands in
sixth place (including second in the prestigious Times
Higher Education World University Rankings). MIT stands
third. It is tenth in the selectivity
(desirability) index.
For all its strengths,
Caltech's
yield of admitted students is low for a top 10 school (thirty-sixth,
30% less than MIT). African-American student representation
is paltry (1.5%), ranking it one-hundred thirty-first out
of the top 133 schools, low even relative to MIT (5.68%,
forty-eighth). Its endowment is less than a sixth of that
of MIT (only thirty-eighth in the nation), though a
respectable
twelfth per student and sixth per undergrad-only. For
other comparisons of the two tech giants go
here.
Based on political donations of the
people who work there, Caltech is the
166th
most liberal university out of 446 (8.0
Liberal;
CrowdPac). This is the
twenty-ninth most liberal school
among the 84 schools of the GCR Top 133
that Crowdpac examines.
Test scores (Fall
2015 / C2019 enrolled students)
Mid-50% (25th
-75th percentile): SAT CR
730-800, M 770-800, W 730-790; ACT 34-35*
Average: CR+M:
1550 (avg. 775), ranked 1st;
CR+M+W:
2310
(avg. 770), ranked 1st;
ACT
(C 2019)
34.5, ranked 1st
Percent submitted SAT/ACT scores:
78%/50% (2014: 88%/41%; 2013: 88%/43%)
* C2019
SAT ranges: 700-800: CR 88.59%, M 98.91% (!), W 87.50%; 600-699
CR 11.41%, M 1.09%, W 12.50%; ACT 30-36: 100%.
Selectivity
Acceptance rate:
Fall 2012:
11.76% / 2013: 10.55%/
2014: 8.83% / 2015: 8.807%
(8th)
Yield
rate
(of accepted students who enroll): Fall 2014 (C2018):
39.24% / Fall 2015
(C2019):
42.06% (36th)
Selectivity index (acceptance ÷ yield:
the lower the score, the more desirable): .2094
(10th)
Net Price
(total expenses – grant/scholarship
aid)
Net price
average
2013-14 (from NCES) for beginning undergrads receiving any
financial aid: $26,700 (41st)
Net price
average
2014-15 (from NCES) for beginning undergrads receiving any
financial aid: $23,003 (16th)
Net price
average 2014-15 (from CDS) for beginning undergrads…:
$20,720
(9th) (total costs $60,780 - average
need-based scholarship $40,060); and for all undergrads:
$23,223 (15th) ($60,780 - $37,557).
Net price
average
2015-16 (from CDS) for beginning
undergrads…:
$25,388 (33rd) (total costs
$63,261 - average need-based scholarship $37,873); and for
all undergrads: $24,278 (19th)
($63,261 - $38,983).
By income (2013-14):
$0 - $30,000: $6486 (11th) / $30,001 – $48,000: $4130
(2nd) /
$48,001 – $75,000: $9053 (7th) /
$75,001 – $110,000: $19,867 (11th)
By income (2014-15):
$0 - $30,000: $9854 (28th) / $30,001 – $48,000: $8118
(15th) /
$48,001 – $75,000: $10,054 (8th) /
$75,001 – $110,000: $31,712 (82nd)
No-loan financial aid package for students whose parents
make
less than $60,000/yr.
Debt at Graduation (incl. rank among the GCR top
133) and Default Rates
Average student debt at graduation
C2014: $12,104 (2nd
lowest) / C2015: $20,677 (30th
lowest)
Percentage of
graduates with debt:
C2014: 32%
(15th
lowest, 3-way tie) / C2015: 39%
(34th
lowest, 5-way tie)
Student loan default rate
2010: 3% / 2011: 0% / 2012: 2.5% / 2013: 1.9%
[4-yr avg.: 1.85%; 3-yr avg: 1.467%]
Graduation Rates, Student Enrollment,
Student/Faculty Ratio, Endowment
1st-year retention
rate (2014-15): 97% (12-way
tie for 15th)
4- & 6-year grad
rate (began Fall
2009): 84.46%
(44th) / 90.84% (42nd)
Entering class size:
C2019: 241 (C2018: 226);
Student pop.
(2015): 2,255 (1001 undergraduates)
Student to faculty ratio: 3 to 1 (1st)
Endowment
(2016):
$2.199 billion (38th
in the US but 12th
per student and 6th
per undergrad-only
)
African American Representation as a Measure of
Diversity
Average number
(and %) per class over 4 undergrad
classes,
*no TOMR (Fall 2015): 4* out of 250 (1.50%)
(131st
in GCR)
Number, incl. those of
TOMR: C2019: 3*; C2018: 2*; C2017: 4*; C2016:
5*
# National Achievement Scholarship Winners
(2014): 3
Earning Potential
PayScale Salary 2016-17:
For All Alumni (insufficient info for Bachelor's Only): Early
career (0-5 years of employment):
$78,400; Mid-career (10+ years): $125,000 (tied
for 14th)
For
Bachelor's Only in 2015-16: Early career (0-5 years
of employment):
$72,600; Mid-career (10+ years): $125,000 (5th)
The
Times Higher Education World University Rankings (UK)
2016-17: 2
The Times Higher Education World Reputation
Rankings
(UK) 2016: 10
QS World University Rankings
(UK) 2016/17: 5
US News Best Global Universities Rankings
2017: 5
Academic Ranking of World Universities
(Shanghai) 2016: 8
Center for World University Rankings
(Saudi Arabia) 2016: 11
Composite Score: 41
(6th
in the world, behind only Harvard, Stanford, MIT, Cambridge,
Oxford)
FIRE Speech Code Rating (Green:
protects; Yellow: may restrict;
Red: clearly restricts)
California
Institute of Technology has been given the speech code rating
Red. A red light university has at least one policy that both
clearly and substantially restricts freedom of speech. Read more
here.
8.
Columbia University,
New York City (Upper Manhattan), NY

"Columbia University 01" [Main
campus, Low Library to the right] by Momos - Own
work. Licensed under CC BY-SA 3.0 via Wikimedia
Commons -
https://commons.wikimedia.org/wiki/File:Columbia_University_01.jpg#/media/File:Columbia_University_01.jpg
Rankings:
US News (NU) 5t +
College Choice (NU)
5 × 2 = 20; plus…
Forbes 16
WSJ/THE
3
Money
52t
College Factual 25
College Raptor
11
Kiplinger
28*
Niche 12
PayScale ROI 16
Total, with unranked or worst
(outlier) score dropped, then full score: 131
(183)
*Columbia was excluded from
Kiplinger’s 2015 and 2016 list because they “did
not supply us with all the data required to
accurately calculate their ranking.”
Columbia’s
highest ranking is third (the new Wall St.
Journal/Times Higher Education
ranking); then in the two lists that exclude liberal
arts colleges:
fifth (US News [tie], down slightly
from last year's fourth; and College Choice).
Otherwise its best rankings are eleventh (College
Raptor, down from last year's eighth place),
twelfth (Niche, up slightly from 2016's
fourteenth and 2015's fifteenth), and twice
sixteenth (Forbes, down slightly from
last year's fifteenth; and PayScale ROI, up
significantly from last year's twenty-eighth). Its
lowest rankings are twenty-fifth (USA Today's
College Factual, up slightly from last year's
twenty-seventh), twenty-eighth (Kiplinger),
and
fifty-second (tied,
Money; significantly down from last year's twenty-eighth).
Columbia averages tenth in world universities
rankings.
As for
affordability, Columbia ranked an impressive
fifth in lowest average net price
among the top 133 GCR schools for
beginning undergrads
receiving any financial aid in 2014-15
(twelfth in 2013-14; using NCES stats that do not
factor in private outside scholarships).
Broken down into parental salary levels, in
2014-15 for beginning undergrads it ranked
eighteenth for incomes $0-$30,000 (2013-14:
thirtieth) and an impressive ninth for
$30,001-$48,000 (2013-14: eleventh), sixth for
$48,001-$75,000 (2013-14: tenth), and fifth
for $75,001-$110,000 (2013-14: seventh). Since
Columbia does not publish its Common Data Sets, no
information is available for 2015-16 that permits a
ranking. Nor was there any information available
regarding its average student loan debt at
graduation.
Among the GCR top
133 Columbia has the
fourth lowest acceptance rate (in part due to
its location in a high density population area), the
seventh highest student yield, and
third highest selectivity (desirability)
index (acceptance rate divided by yield). It is tied
for the ninth (CR+M+W) and tenth (CR+M)
highest SAT scores, as well as in a 6-way
tie for fourth highest composite ACT score.
Columbia has the fifth lowest student-to-teacher
ratio (5-way tie), surpassed in the Ivies only
by Princeton and tied by Yale and UPenn. Its
four-year graduation rate is twelfth (4-way tie;
among the Ivies only Princeton does better;
Dartmouth equals); its 6-year rate eighth
(5-way tie). With regard to a first-year
retention rate, it is in a 16-way tie for
thirty-fourth (but still high: 95%). Its
PayScale Mid-Career Salary rank is a
surprisingly low thirty-fourth (tie).
Columbia
also has the
ninth highest endowment among US schools, the
twelfth highest endowment per undergrad, and (only)
the forty-seventh highest endowment per student
(including grad students). It has the
sixteenth highest percentage of African-American
students (among the Ivies only .3% off
first-place Princeton). With its setting in upper
Manhattan Columbia offers the ideal location for
anyone seeking the full range of cultural
opportunities that urban life can afford (including
location near great museums and theaters) and who is
not bothered by the downside (traffic, crime, cost
of living).
Niche
ranks Columbia no. 21 among the “2017
Most
Liberal Colleges in America.”
Based on political donations of the people who work
there, Columbia University is the 233rd
most liberal university out of 446 (7.6 Liberal;
CrowdPac). This is the
forty-third most liberal school among the 84
schools of the GCR Top 133 that Crowdpac examines.
Test scores
(Fall 2014 / C2018 enrolled students)
Mid-50%
(25th
-75th percentile): SAT CR 690-780, M
700-790, W 700-780; ACT 32-35*
Average:
CR+M:
1480 (avg. 740), ranked 11th
(tied);
CR+M+W:
2220 (avg. 740), ranked 10th (tied);
ACT
33.5, ranked 3rd (7-way tie)
Percent submitted SAT/ACT scores
(2014): 81%/34% (2012: 90%/32%)
Selectivity
Acceptance rate:
Fall 2012: 7.42% / 2013:
6.89% / 2014:
6.95% / 2015: 6.13%
(3rd)
Yield
rate (of accepted students who enroll) Fall 2014
(C2018): 63.85% / Fall 2015 (C2019):
65.14
Selectivity index
(acceptance ÷ yield: the lower the score, the more
desirable): .0941
(4th)
Net
Price
(total expenses –
grant/scholarship aid)
Net price
average
2013-14 (from NCES) for
beginning undergrads receiving any financial aid:
$22,310 (12th)
Net price
average
2014-15 (from NCES) for
beginning undergrads receiving any financial aid:
$22,310 (12th)
Note: Columbia does not publish
online its CDSs.
According to its
website, in 2015-16 "50% of Columbia students
receive[d] grants from Columbia and the average
amount awarded is $46,516." This amount does not
factor in government grants and private outside
scholarships. The full cost of attendance in 2015-16
was $70,360. "16% of Columbia’s undergraduates
receive the Pell Grant, a Federal Grant reserved for
the students with the highest need in the country."
By income (2013-14):
$0 - $30,000: $10,614 (30th) / $30,001 –
$48,000: $6779 (11th) / $48,001 –
$75,000: $10,682 (10th) /
$75,001 – $110,000: $18,615
(7th)
By income (2013-14):
$0 - $30,000: $8505 (18th) / $30,001 –
$48,000: $6038 (9th) /
$48,001 – $75,000: $9876 (6th)
/
$75,001 – $110,000: $17,354
(4th)
No parental
contributon expected
for families making less than $60,000/yr. The
only payment expected is from the student’s summer
earnings, part-time employment, and any savings the
student may have. A no-loan policy for all
financial aid awards.
Debt at Graduation (incl. rank among
the GCR top 133) and Default Rates
Average student debt at graduation
[no info available]
Percentage of C2014 graduates with
debt:
[no info available]
Student loan default rate
2010: 2.9% / 2011: 2% / 2012: 1.7% / 2013:
1.4% [4-yr avg.:
2%; 3-yr avg: 1.7%]
Graduation Rates, Student Enrollment,
Student/Faculty Ratio, Endowment
1st-year retention
rate (2013-14):
96%
4- & 6-year grad
rate
(began Fall 2008):
88%/95%
Entering class size:
C2019:
1406 (C2018: 1430);
Student pop.
27,589 (6170
undergraduate)
Student to faculty ratio:
6 to 1
Endowment
(2016):
$9.04 billion
(9th
in the US*, 10th
in the world**; in the US 47th
per student and
12th
per undergrad-only)
*My endowment ranking counts only individual
universities, not university systems like those
of the Texas A&M University and the University
of Michigan. Texas A&M University System had an
endowment of $10.54 billion in 2016,
comprising 11 universities with 143,000
students, along with “seven state agencies, two
service units and a comprehensive health science
center” (the student population at College
Station is thus 44.6% of the whole). US News
lists the 2015 endowment as $9.754 billion (93%
of the system endowment). I compromised 70% of
the system endowment: $7.38 billion. The
University of Michigan System had an endowment
of $9.74 billion in 2016. The University
of Michigan in Ann Arbor operates satellite
campuses in Flint and Dearborn with a combined
student body of 17,500 as compared to the over
43,651 student body at Ann Arbor. Since the
student body figure for the satellite campuses
is 28.7% of the whole and US News gives for the
2015 endowment of the flagship school $9.8097
(98.6% of the system endowment) I compromised
with a 10% reduction from the system endowment,
leaving $8.77 billion for Ann Arbor.
**The only non-US university with a larger
endowment is King Abdullah University of
Science and Technology in Saudi Arabia ($20
billion in 2013). The next largest endowments
outside the US are the University of Cambridge
($7.3 billion in 2014) and the University of
Oxford ($5.83 billion in 2015).
African American Representation as a
Measure of Diversity
Average number
(and %) per class over 4
undergrad classes,
*no TOMR (Fall 2015):
158*
(7.34% in GCR)*
Number, incl. those of TOMR:**
C2019: 160; C2018: 162; C2016: 201
# National Achievement Scholarship
Winners
(2014): 34
Earning Potential
PayScale Salary 2016-17:
Early career (0-5 years of employment):
$64,000; Mid-career (10+ years):
$109,000 (tie for 34th)
World Rankings
The
Times Higher Education World University Rankings
(UK) 2016-17: 16
The Times Higher Education World
Reputation Rankings (UK) 2016: 9
QS World University Rankings
(UK) 2016/17: 20
US News Best Global Universities Rankings
2017: 9
Academic Ranking of World Universities
(Shanghai) 2016: 9
Center for World University Rankings
(Saudi Arabia) 2016: 6
Composite Score: 69
(10th; behind Princeton
[q.v.] and the 6 schools in front of it; plus UChicago and
UCal-Berkeley)
FIRE Speech Code
Rating (Green:
protects; Yellow:
may restrict;
Red: clearly restricts)
Columbia
University has been
given the speech code
rating Red. A red light
university has at least
one policy that both
clearly and
substantially restricts
freedom of speech. Read
more
here.
“Campus Pride”
Index
Rating:
4 out of 5 stars
This is an overall
indicator of an
institution’s zealous
promotion of an “LGBTQ”
agenda to the detriment
of any who have moral
qualms about such an
agenda, through coercive
indoctrination, active
“diversity” recruitment,
special resourcing,
sanctions, and slander
of those who support a
male-female foundation
for sexual unions as
“hateful, ignorant,
homophobic bigots” on a
par with racists. For
moderate-to-conservative
students it represents
the greatest threat to
their freedom of speech
and association, faith
and religious liberty,
and due process at this
institution. Applicants
may still thrive in this
oppressive environment,
off-set by association
with like-minded
persons, but should be
aware of the risks
before applying.
9.
Duke University,
Durham, NC
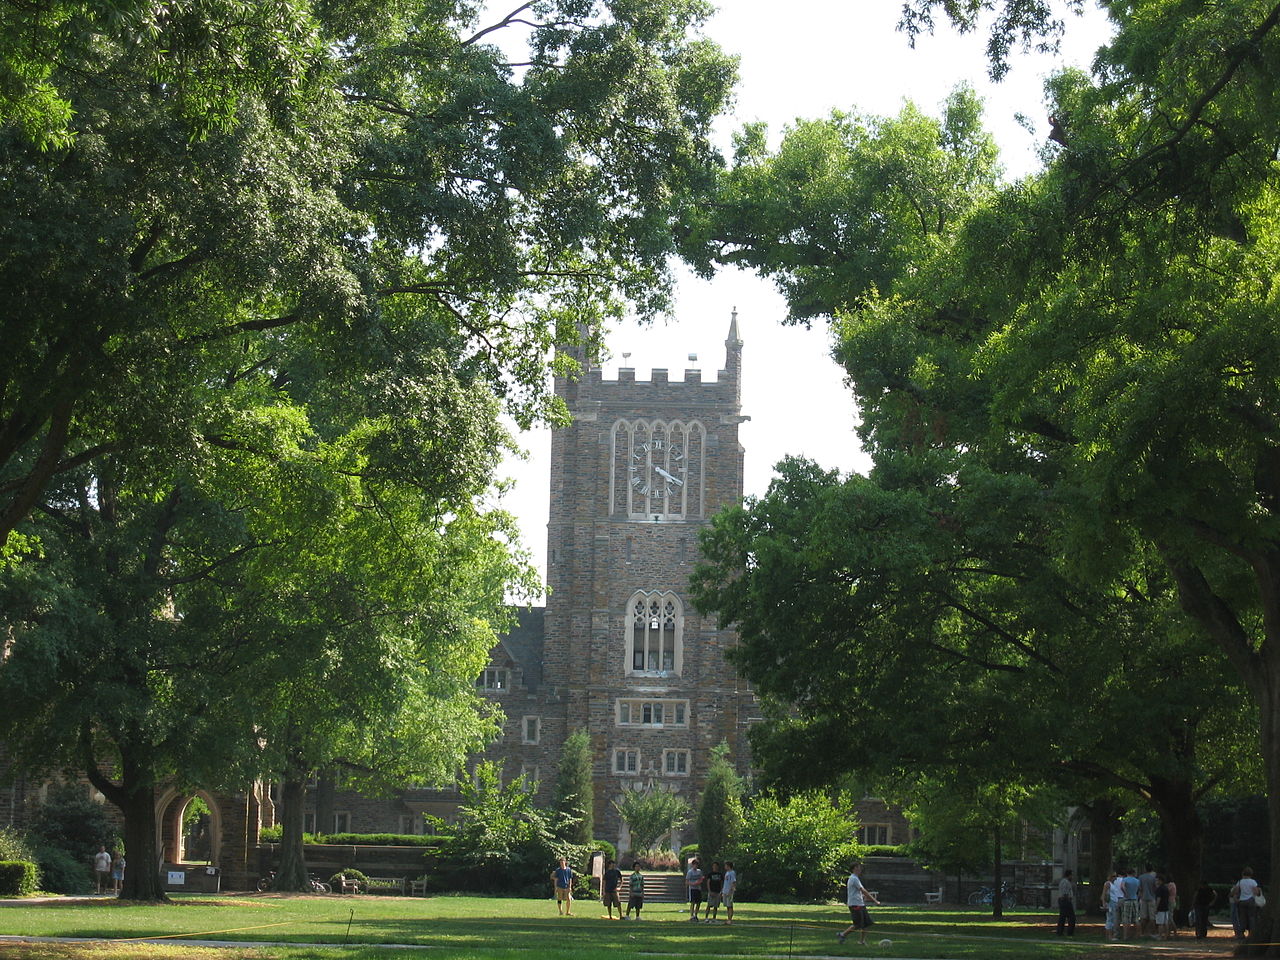
Rankings:
US News (NU) 8t +
College Choice (NU)
8 × 2 = 32; plus…
Forbes 26
WSJ/THE
7
Money
39
College Factual
4
College Raptor
18
Kiplinger
4
Niche
11
PayScale ROI 37
Total, with unranked or worst (outlier) score dropped, then
full score: 139
(178)
This no. 1 school of the
South might be better known for its college basketball team, the
Blue Devils. Yet make no mistake about it: Duke belongs in the
upper tier of the top universities and colleges nationally. Its
best ratings among the ten lists consulted here are fourth
(twice: USA Today's College Factual, up slightly from
2016's fifth and down slightly from 2015's third;
Kiplinger, up from 2016's eleventh and 2015's tenth) and
seventh
(Wall St. Journal/Times Higher Education), with two
others rating it eighth (US News [same as last
year, except now tied] and College Choice, among national
research universities). It is ranked outside the top 10 but
still in the ballpark in its
eleventh (Niche, down from last year's seventh; in
2015 also eleventh) and
eighteenth (College Raptor, down from last year's
sixteenth) place rankings. Out of the top 10 ballpark are three
rankings: twenty-sixth (Forbes, down from last
year's twenty-second), thirty-seventh (PayScale ROI,
way down from last year's twenty-second), and thirty-ninth
(Money, way down from last year's tie for twenty-second).
US News also ranks Duke #14 (4-way tie) in
Best Undergraduate Teaching among National Universities. Duke is ranked twentieth
in the world according to the GCR composite world
rankings list (fifteenth among US schools in the list).
As for
affordability, Duke ranked eleventh in lowest average net
price among the top 133 GCR schools
for beginning undergrads receiving any financial
aid in 2014-15 (sixteenth in 2013-14; using NCES stats
that do not factor in private outside scholarships). Broken down
into parental salary levels, in 2014-15 for beginning undergrads
it ranked forty-sixth for incomes $0-$30,000 (2013-14:
twenty-second), an impressive third for $30,001-$48,000
(2013-14: thirty-eighth) and
fifth for $48,000-$75,000 (2013-14: thirty-fourth), and
thirty-sixth for $75,000-$110,000 (2013-14: forty-fifth).
For all
undergrads receiving any financial aid in 2014-15
(compiled from CDSs that factor in private outside scholarships)
it ranked
thirteenth (stats not yet available for Harvard and
Columbia). Duke's average student loan at graduation for
that portion of the Class of 2015 taking out any loans was
twentieth among the GCR top 139 schools; the percentage
of students graduating with debt was the twenty-third lowest
(tie).
In 2015 Duke has the
fourteenth highest endowment in the US (sixteenth highest in
the world); per undergrad it is ranked seventeenth and per
student (including grad students) thirty-third. Its
PayScale Mid-Career Salary rank is thirteenth
(4-way tie). Among the GCR top 133 Duke has the third highest
African-American representation. In Fall 2015 Duke had
the fifteenth lowest acceptance rate, the fifteenth highest
yield rate, and the thirteenth best selectivity
(desirability) index. Its Fall 2015 class had the seventeenth
(CR+M+W) and eighteenth (CR+M)
highest SAT score and was in a 9-way tie for the
fifteenth highest composite ACT
score. Duke's student-to-faculty ratio puts it in a
16-way tie for fifteenth; its first-year retention rate
in a 15-way tie for fifteenth; its 4-year graduation
rate in a 4-way tie for twenty-second; and its
6-year graduation rate in a 5-way tie for eighth.
Based on political donations of the people who work there, Duke
University is the 332nd
most liberal university out of 446 (6.8 Liberal;
CrowdPac). This is the
sixty-seventh most liberal school among the 84 schools of
the GCR Top 133 that Crowdpac examines.
Test scores (Fall
2015 / C2019 enrolled students)
Mid-50%
(25th
-75th percentile): SAT CR 670-760, M 690-790, W
690-780; ACT 31-34
Average: CR+M:
1455 (avg. 727.5), ranked 18th;
CR+M+W:
2190 (avg. 730), ranked 17th;
ACT
32.5, ranked 15th (9-way tie)
Percent submitted SAT/ACT scores:
67%/56% (2014: 72%/50%; 2013: 75%/49%)
Selectivity
Acceptance rate: Fall 2012:
13.42% / 2013: 12.44%
/ 2014: 11.41% / 2015:
11.84%
(15th)
Yield
rate (of accepted students who enroll) Fall 2014
(C2018): 47.86% / Fall 2015 (C2019): 48.93% (15th)
Selectivity index (acceptance ÷ yield:
the lower the score, the more desirable): .2420 (13th)
Net Price
(total expenses – grant/scholarship
aid)
Net price
average
2013-14 (from NCES) for beginning
undergrads receiving any financial aid: $22,794 (16th)
Net price
average
2014-15 (from NCES) for beginning
undergrads receiving any financial aid: $22,329 (11th)
Note: Duke does not publish online its CDSs.
Net price average
2014-15 (from CDS) for beginning undergrads…: $24,192
(29th) (total costs
$65,033 - average need-based scholarship $40,841*); and for
all undergrads: $23,123 (12th)
($65,033 - $41,910*).
*Data supplied in private correspondence with Duke. But
here Duke advertised that the average need-based grant
for 2014-2015 was $42,345, which would mean a net price of
$22,688.
By income (2013-14):
$0 - $30,000: $9807 (23rd) / $30,001 –
$48,000: $12,945
(39th) / $48,001 – $75,000: $17,210 (35th)
/ $75,001 – $110,000: $26,115
(45th)
By income (2014-15):
$0 - $30,000: $12,938 (46th) / $30,001 –
$48,000: $4351 (3rd) / $48,001 – $75,000:
$8607 (5th) /
$75,001 – $110,000: $25,106 (36th)
No parental contribution expected
for families making less than $60,000/yr. The only
payment expected is from the student’s summer earnings,
part-time employment, and any savings the student may have.
Graduated loan policy:
No loans for those with family incomes less than $40,000.
Graduated loans for those making $40,000-$100,000: $2000 loan
for $40,000-$55,000; $3000 loan for $55,000-$70,000; $4000 loan
for $70,000-$85,000; $5000 loan for $85,000 and over.
Debt at Graduation (incl. rank among the GCR top
133) and Default Rates
Average student debt at graduation
C2014:
$20,556 (35th
lowest) / C2015: $19,104 (20th
lowest)
Percentage of
graduates with debt:
C2014: 36%
(24th
lowest, 3-way tie) / C2015: 35%
(23rd
lowest, tie)
Student loan default rate
2010: 1% / 2011: 1.1% / 2012: .6% / 2013: .4%
[4-yr avg.: .775%; 3-yr avg: .7%]
Graduation Rates, Student Enrollment,
Student/Faculty Ratio, Endowment
1st-year retention
rate (2013-14): 97%
(12-way tie for
15th)
4- & 6-year grad
rate (began Fall
2009): 86.18%
(30th)
/ 95% (5-way
tie for
8th)
Entering class size:
C2019: 1745 (C2018: 1721);
Student pop.
15,984 (6,639 undergraduate)
Student to faculty ratio
(2015-16): 6 to 1 (6-way tie
for 4th)
Endowment
(2016):
$6.84 billion (14th
in the US, 16th
in the world*; in the US 33rd
per student and 17th
per undergrad-only)
*The only non-US
universities with a larger endowment are King Abdullah
University of Science and Technology in Saudi Arabia ($20
billion in 2013), the University of Cambridge ($7.3 billion in
2014), and possibly (though not likely) the University of Oxford
($5.83 billion in 2015)
African American Representation as a Measure of
Diversity
Average number
(and %) per class over 4 undergrad classes,
*no TOMR (Fall 2015): 158* (9.75%) (3rd
in GCR)
Number, incl. those of TOMR:1
C2019: 193 (162*); C2018: 190 (168*); C2017: 163*; C2016:
198 (171*)
# National Achievement Scholarship Winners
(2014): 18
1 C2019
AfrA 11% (incl. multi-); same % C2018:
http://admissions.duke.edu/images/uploads/process/DukeClass2018Profile.pdf.
Earning Potential
PayScale Salary 2016-17:
Early career (0-5 years of employment):
$61,300; Mid-career (10+ years):
$119,000 (13th, 4-way tie)
The
Times Higher Education World University Rankings (UK)
2016-17: 18
The Times Higher Education World Reputation
Rankings (UK) 2016: 28
QS World University Rankings
(UK) 2016/17: 24
US News Best Global Universities Rankings
2017: 19t
Academic Ranking of World Universities
(Shanghai) 2016: 25
Center for World University Rankings
(Saudi Arabia) 2016: 29
Composite Score: 143 (20th
in the world, 15th among US schools; behind UPenn and
the twelve schools in front of it, plus Cornell, Johns Hopkins, Imperial
College [London],
Swiss Federal Institute of Technology,
University College [London], UMichigan)
FIRE Speech Code Rating (Green:
protects; Yellow: may
restrict;
Red: clearly restricts)
Duke
University has been given the speech
code rating Yellow. Yellow light
colleges and universities are those
institutions with at least one
ambiguous policy that too easily
encourages administrative abuse and
arbitrary application. Read more
here.
“Campus
Pride” Index
Rating:
4 out of 5 stars
This is an
overall indicator of an
institution’s zealous promotion of
an “LGBTQ” agenda to the detriment
of any who have moral qualms about
such an agenda, through coercive
indoctrination, active “diversity”
recruitment, special resourcing,
sanctions, and slander of those who
support a male-female foundation for
sexual unions as “hateful, ignorant,
homophobic bigots” on a par with
racists. For
moderate-to-conservative students it
represents the greatest threat to
their freedom of speech and
association, faith and religious
liberty, and due process at this
institution. Applicants may still
thrive in this oppressive
environment, off-set by association
with like-minded persons, but should
be aware of the risks before
applying.
10.
Brown University,
Providence, RI

"Brown University Sayles Hall" by Ad
Meskens - Own work. Licensed under CC BY-SA 3.0 via
Wikimedia Commons -
https://commons.wikimedia.org/wiki/File:Brown_University_Sayles_Hall.JPG#/media/File:Brown_University_Sayles_Hall.JPG
Rankings:
US News (NU) 14 +
College Choice (NU)
14 × 2 = 56; plus…
Forbes 8
WSJ/THE
20
Money
31t
College Factual
7
College Raptor
15
Kiplinger
21
Niche
10
PayScale ROI 26
Total, with unranked or worst
(outlier) score dropped, then full score: 163
(194)
Brown University
has
a third of its ten rankings in the top 10: one in
seventh place (USA Today's
College Factual, down slightly from last year's
sixth), one in eighth (Forbes, same as
previous year), and one in tenth (Niche,
down slightly from 2016's eighth but up from 2015's
twelfth); a third more between 11 and 20, in
fourteenth (US News [same as last year]
and
College Choice
for national universities), fifteen (College Raptor,
up from last year's eighteenth place), and twentieth
place (Wall St. Journal/Times Higher Education);
and finally a third more between 21 and 31:
twenty-first (Kiplinger, up from 2016's
thirty-first and 2015's twenty-eighth), twenty-sixth
(PayScale's
Return of Investment), and thirty-first (Money,
up slightly from last year's thirty-second place, both
tied). US News also ranks Brown #4 in
Best Undergraduate Teaching among National Universities. Its place on the GCR composite world ranking
list is only seventy-third (second lowest in the
Ivy League, with only Dartmouth lower).
In terms of
affordability for the past several years Brown has
averaged nineteenth in net price when different
income levels are factored in and twenty-first when they are
not. Brown's average student loan at graduation
for that portion of the Class of 2015 taking out any loans was
only forty-ninth among the GCR top 133 schools; the percentage
of students graduating with debt was the eighteenth
lowest. Brown expects no
parental contribution for families making less than $60,000 and there
is a no-loan financial aid policy for those under
$100,000.
Brown's best
ratings are
its 6-year graduation rate (95.5%, sixth),
acceptance rate (9.3%, ninth) and selectivity
(desirability) index (ninth), yield rate (55.8%,
eleventh), first-year retention rate (97.8%,
twelfth), and student to faculty ratio (7.2 to 1,
fourteenth). Its lowest ratings are its
African-American student representation (6.5%,
thirtieth), endowment ($3 billion, thirtieth;
fiftieth per student), and four-year graduation rate
(83.6%, fifty-first). Brown also has
a
bad "red-light" rating as regards a restrictive
speech code, according to FIRE.
Niche
ranks Brown no. 6 among the “2017
Most
Liberal Colleges in America.” The Princeton Review
list of the top 20 schools with the “Most
Liberal Students” puts Brown at no. 20 (the only GCR
top 40 school to make the list).
Based on political donations of the people who work
there, Brown University is the 137th
most liberal university out of 446 (8.1 Liberal;
CrowdPac). This is the
twenty-third most liberal school among the 84
schools of the GCR Top 133 that Crowdpac examines; third
among the Ivies behind Cornell and Dartmouth.
Test scores of enrolled students
Fall 2016 (C2020):
Mid-50%
(25th
-75th percentile):
SAT CR 680-780, M 690-790, W
690-780; ACT 31-34*
SAT
Average: CR+M:
1470 (avg. 735), ranked 9th +
CR+M+W: 2205
(avg. 735), ranked 7th +
ACT
composite average:
32.5, ranked 10th (8-way tie)
Percent
submitted SAT/ACT scores: 67%/49%
* For
C2020 there are charts showing distribution of test
scores by applicants with admit and enroll rates:
https://www.brown.edu/admission/undergraduate/explore/admission-facts.
Fall 2015 (C2019):
Mid-50%
(25th
-75th percentile):
SAT CR 680-780, M 690-780, W
690-780; ACT 31-34
SAT Average: CR+M:
1465 (avg. 732.5), ranked 15th (tied)
CR+M+W: 2200 (avg. 733.3), ranked 13th
(4-way tie)
ACT composite average: 32.5,
ranked 15th
(8-way tie)
Percent
submitted SAT/ACT scores:
71%/44% (2014: 77%/40%; 2013: 79%/38%)
Selectivity
Acceptance rate: Fall
2012:
9.60% / 2013:
9.18% / 2014: 8.74% /
2015: 9.458%
(9th) / 2016: 9.305% (9th
among GCR Top 133)
Yield
rate
(of accepted students who enroll) Fall 2014:
58.7% / 2015: 56.17% (9th) / 2016:
55.77% (11th)
Selectivity index
(acceptance ÷ yield: the lower the score, the more
desirable): Fall 2015: .1684
(9th) / 2016: .1677 (9th)
Net Price
(total expenses – grant/scholarship
aid)
Net price
average 2016-17 for beginning undergrads…:
$25,880 (28th+) (total costs
$69,066 - average need-based scholarship $43,186);
and for all undergrads: $24,961 (16th+)
($69,066 - $44,105)
Net price
average
2015-16 (from CDS) for beginning undergrads…:
$24,437 (30th) (total costs
$66,546 - average need-based scholarship $42,109);
and for all undergrads: $23,501 (15th)
($66,546 - $43,045).
Net price
average
2014-15 (from NCES) for
beginning undergrads receiving any financial aid:
$24,191 (26th)
Net price
average
2014-15 (from CDS) for beginning undergrads…:
$22,830 (18th) (total costs
$63,928 - average need-based scholarship $41,098);
and for all undergrads: $23,011 (12th)
($63,928 - $40,917).
Net price
average
2013-14 (from NCES) for
beginning undergrads receiving any financial aid:
$22,465 (13th)
By income
(2014-15): $0 -
$30,000: $5929 (7th) / $30,001 – $48,000:
$8353 (18th) / $48,001 – $75,000: $14,440
(24th) /
$75,001 – $110,000: $22,377 (20th)
By income
(2013-14): $0 -
$30,000: $4458 (8th) / $30,001 – $48,000:
$8401 (16th) / $48,001 – $75,000: $11,972
(13th) /
$75,001 – $110,000: $23,554 (25th)
No parental
contribution expected
for families making less than $60,000/yr with
assets less than $100,000. The
only payment expected is from the student’s summer
earnings, part-time employment, and any savings the
student may have. A no-loan financial aid policy
for families earning less than $100,000/yr; for
those making between $100,000 and $125,000 the cap on
four-year debt is $12,000.
Debt at Graduation (incl. rank among the
GCR top 133) and Default Rates
Average student debt at graduation
C2014: $24,300 (65th
lowest) / C2015: $22,197 (49th
lowest)
Percentage of graduates with debt:
C2014: 35%
(22nd
lowest, tie) / C2015: 34%
(18th
lowest, 5-way tie)
Student loan default rate
2010: 2% / 2011: 1.3% / 2012: .5% / 2013: 1.7%
[4-yr avg.: 1.375%; 3-yr avg: 1.167%]
Graduation Rates, Student Enrollment,
Student/Faculty Ratio, Endowment
1st-year retention rate (2014-15):
98% (6-way tie for 3rd) /
(2015-16) 97.8% (12th)
4- & 6-year grad rate
(began Fall 2009): 83.03% (47th)
/ 95.91% (5th) / (began Fall 2010):
83.57% (51st) / 95.46% (6th)
Entering class size:
C2020: 1,681 (C2019: 1615; C2018: 1567)
Student pop.: (Fall 2016) 9,781
(6,926 undergrad) / (Fall 2015) 9,458 (6,652 undergrad)
Student to faculty ratio
(2016-17): 7.19 to 1 (14th)
Endowment
(2016):
$2.96 billion (30th
in the US*, 33rd to 35th in
the world; in the US
50th per student and 36th
per undergrad-only)
*One notch
lower if one counts the entire Ohio State University
endowment. In addition to its main campus, OSU also
governs regional campuses in Wooster, Lima, Mansfield,
Marion, and Newark. Given their miniscule size in
comparison to the main campus (a combined student body
of 6,600 compared to the main campus student body of
over 58,300, i.e. 10% of the total), the kind of major
adjustment that I have given to flagship public
universities with larger systems is not necessary. I
deducted only 10% from the entire endowment of OSU ($3.634
billion) to arrive at a figure for the main campus
of $3.27 billion.
African American Representation as a
Measure of Diversity
Average number
(and %) per class over 4
undergrad classes,
*no TOMR (Fall 2016):
107*/1645 (6.52%)
(30th
in GCR)
Number, incl. those of TOMR:
C2019:
100*; C2018: 106*; C2017: 117*;
C2016: 111* (1461)
1
As elsewhere the C2016 (= Fall 2012) figure is from “Black
First-Year Students at the Nation’s Leading Research
Universities,” Journal of Blacks in
Higher Education, Dec. 17, 2012. On their own site
Brown for C2016 has Black 9% (which would be 140;
includes multi-):
http://www.brown.edu/admission/undergraduate/sites/brown.edu.admission.undergraduate/files/uploads/BrownByNumbers.pdf.
Earning Potential
PayScale Salary 2016-17:
Early career (0-5 years of employment):
$58,600; Mid-career (10+ years):
$116,000 (20th)
World Rankings
The
Times Higher Education World University Rankings
(UK) 2016-17: 51t
The Times Higher Education World
Reputation Rankings (UK) 2016:
71-80
QS World University Rankings
(UK) 2016/17: 49
US News Best Global Universities Rankings
2017: 85t
Academic Ranking of World Universities
(Shanghai) 2016: 90t
Center for World University Rankings
(Saudi Arabia) 2016: 87
Composite Score: 437
(averages 73rd in the
world)
FIRE Speech Code Rating (Green:
protects; Yellow: may restrict;
Red: clearly restricts)
Brown
University has been given the speech code rating
Red. A red light university has at least one policy
that both clearly and substantially restricts
freedom of speech. Read more
here.
Selected by
Princeton Review as tenth among the
Top 20
“LGBTQ-Friendly” Colleges and Universities
This is an overall indicator
of an institution’s zealous promotion of an “LGBTQ”
agenda to the detriment of any who have moral qualms
about such an agenda, through coercive
indoctrination, active “diversity” recruitment,
special resourcing, sanctions, and slander of those
who support a male-female foundation for sexual
unions as “hateful, ignorant, homophobic bigots” on
a par with racists. For moderate-to-conservative
students it represents the greatest threat to their
freedom of speech and association, faith and
religious liberty, and due process at this
institution. Applicants may still thrive in this
oppressive environment, off-set by association with
like-minded persons, but should be aware of the
risks before applying.
11.
Dartmouth College,
Hanover, NH

"Dartmouth College campus 2008-08-20
Dartmouth Hall 01 - edit 1" by Kane5187 - Own work.
Licensed under Public Domain via Wikimedia Commons -
https://commons.wikimedia.org/wiki/File:Dartmouth_College_campus_2008-08-20_Dartmouth_Hall_01_-_edit_1.jpg#/media/File:Dartmouth_College_campus_2008-08-20_Dartmouth_Hall_01_-_edit_1.jpg
Rankings:
US News (NU) 11 +
College Choice (NU) 10 × 2 = 44; plus…
Forbes 17
WSJ/THE
16
Money
33
College Factual 11
College Raptor
22
Kiplinger 26
Niche
13
PayScale ROI 19
Total, with unranked or worst
(outlier) score dropped, then full score: 167
(200)
Dartmouth
College is the smallest of the Ivy League colleges, with
Princeton and Yale each having respectively only 210 and
250 more undergraduates per class. Though having a
number of graduate schools, it continues to focus on
undergraduate education, albeit with a student-teacher
ratio a bit higher than four or five other Ivies. It is the premier New
England college north of Massachusetts and proud of its
winter activities for easing the discomfort of the cold.
Its best
rankings are
tenth (College Choice
for national universities only), twice eleventh (US
News
for national universities only; and USA Today's
College Factual; in both lists up slightly from last
year's twelfth), thirteenth
(Niche, up substantially from 2016's
twenty-second and 2015's twenty-seventh), sixteenth
(Wall St. Journal/Times Higher Education),
seventeenth (Forbes, down from fourteenth
last year), and nineteenth (PayScale Return on
Investment, up from last year's twenty-fifth). Its
worse rankings are twenty-second (College
Raptor, down substantially from thirteenth the
previous year),
twenty-sixth (Kiplinger, compare 2016's
twenty-seventh and 2015's twenty-third), and
thirty-third (Money, down substantially from
last year's twenty-first). US News also ranks
Dartmouth #7 (3-way tie) in
Best Undergraduate Teaching among National Universities. In the GCR composite world
ranking list, Dartmouth ranks
one-hundred fortieth-plus, lowest among the Ivies
by a substantial amount.
In terms of affordability for the past several years
Dartmouth has averaged sixteenth in net price (both when different
income levels are factored in and when they are
not). Dartmouth's average student loan at graduation
for that portion of the Class of 2015 taking out any loans was
twenty-first among the GCR top 133 schools; the percentage
of students graduating with debt was only the fifty-first
lowest (9-way tie). Dartmouth does not have a full-ride
provision for students whose parents make less than $60,000/yr
(unlike other Ivies) but it does have a free-tuition, no-loan
financial aid package for students whose parents earn
less than $100,000/yr.
Relative to its overall
rank, Dartmouth performs best in its six-year
graduation rate (96.6%, fifth in the GCR Top 133); then
its four-year graduation rate (88.1%, thirteenth in the GCR),
acceptance rate (10.6%, thirteenth in the GCR),
first-year retention rate (97.5%, tied for thirteenth in the
GCR), mid-career salary average according to PayScale (a
4-way tie for thirteenth among all schools).
It performs rank-wise "worst" in its absolute endowment
(but still $4.47 billion, twenty-first in the US; seventeenth
per student and sixteenth per undergrad-only), SAT (CR+M)
average for its entering class (1445, 3-way tie for
twentieth in the GCR), and African-American representation
in the student body (6.9%, twentieth in the GCR). All other
rankings categories (apart from affordability) range from
fifteenth to nineteenth. So the only outlier ranks are the
six-year grad rate (fifth) and the percentage of students
graduating with debt (fifty-first); otherwise Dartmouth
consistently ranks between thirteenth and twenty-first.
In November 2015 there was a startling incident at
Dartmouth in connection with a “Black Lives Matter”
protest in which some of the protestors screamed
profanities at students studying at the main library for
not joining the protest, bullying them, and blocking the
movement of one or more students. One administrator
apologized not to the students who were intimidated and
verbally assaulted but to the protestors, complaining
that conservatives were "not nice." The President issued
an initial tepid school-wide email and only later, in
response to a media storm, suggested that sanctions
might be in order for the protestors (I am not aware of
any sanctions being imposed). The incident
raises questions about double standards by Dartmouth
administrators, particularly against moderates and
conservatives, and whether Dartmouth can be a welcoming
place for all students. For the story go
here,
here,
here,
here,
here, and
here.
In August 2013
President Hanlon withdrew a job offer to James
Tengatenga, a bishop of the Anglican Church in Malawi,
to be Dean of the Tucker Foundation (which oversees
spiritual, ethical, and social justice matters at the
College) simply because previously Bishop Tengatenga had
held the historic and orthodox Christian view that
homosexual practice was sinful; a decade earlier he had
been critical of Gene Robinson's appointment as the
Episcopal Church's first "gay bishop." Even though
Tengatenga now expressed support for "gay rights" and
even "gay marriage" he could not save his job. The
College then hired as Director of Religious and
Spiritual Life of the Tucker Foundation (now
restructured to split the religious aspect from
community service) a
lesbian Episcopal priest. By Dartmouth standards
Jesus and Paul could not have qualified for the job of
spiritual and moral leadership at Dartmouth. So much for
diversity. (For the story go
here,
here, and
here.)
On a similar
note, the evangelical group Christian Union has
been repeatedly denied recognition as an official
student group, despite its phenomenal growth and
recognition of similar chapters at other Ivy League
schools. Even though other officially recognized groups
are allowed to require that leaders agree with the
stated purposes of the group, CU was rejected because it
required its leaders to be professing Christians who
abided by orthodox Christian sexual ethics. Dartmouth
alone among the Ivy League does not allow recognized
religious groups the same freedom of expression and
association that recognized non-religious groups have
(for more info go
here,
here, and
here).
Based on political donations of the people who work
there, Dartmouth College is the 124th
most liberal university out of 446 (8.2 Liberal;
CrowdPac). This is the
twenty-first most liberal
school among the 84 schools of the GCR Top 133 that
Crowdpac examines and second among the Ivies.
Test scores of enrolled students
Fall 2016 (C2020):
Mid-50%
(25th
-75th percentile):
SAT CR 670-780, M 680-780, W
680-790; ACT 30-34
SAT
Average: CR+M:
1455 (avg. 727.5), ranked 13th +
CR+M+W: 2190
(avg. 730), ranked 8th + (3-way tie)
ACT
composite average:
32.5, ranked 18th (6-way tie)
Percent
submitted SAT/ACT scores: 51%/47%
*C2020 SAT actual
means were: CR 717; M 723, W 722; ACT 32.
https://admissions.dartmouth.edu/facts-advice/facts/testing-statistics.
Fall 2015 (C2019):
Mid-50%
(25th
-75th percentile):
SAT CR 660-780, M 670-780, W
670-780; ACT 30-34*
SAT Average: CR+M:
1445 (avg. 722.5), ranked 20th
(3-way tie)
CR+M+W: 2170 (avg. 723.3), ranked 19th
(tie)
ACT composite average: 32,
ranked 23rd (5-way tie)
Percent
submitted SAT/ACT scores:
59%/41% (2014: 65%/35%; 2012: 69%/31%)
*C2019 SAT actual
means were: CR 717; M 722, W 721; ACT 32.
https://admissions.dartmouth.edu/facts-advice/facts/testing-statistics.
Selectivity
Acceptance rate:
Fall 2012:
9.78% / 2013:
10.42%
/ 2014: 11.50% / 2015:
10.97%
(13th) / 2016: 10.59% (13th
among GCR Top 133)
Yield
rate (of accepted students who enroll) Fall 2014
(C2018):
51.89% / 2015:
49.6%
(13th) / 2016: 51.19% (16th)
Selectivity index
(acceptance ÷ yield: the lower the score, the more
desirable):
.2212 (12th)
/ 2016:
.2069 (15th)
Net Price
(total expenses – grant/scholarship
aid)
Net price
average 2016-17 for
beginning undergrads…: $21,649 (7th +)
(total costs
$70,674 - average need-based scholarship $49,025);
and for all undergrads: $23,904 (10th +)
($70,674 - $46,770)
Net price
average 2015-16
(from CDS) for beginning undergrads…:
$21,717 (13th) (total costs
$68,634 - average need-based scholarship $46,917);
and for all undergrads: $23,854 (18th)
($68,634 - $44,780)
Net price
average 2014-15
(from NCES) for beginning undergrads receiving any financial
aid: $22,662
(12th)
Net price
average 2014-15
(from CDS) for beginning undergrads…:
$21,770 (13th) (total costs
$66,617 - average need-based scholarship $44,847);
and for all undergrads: $24,318 (22nd)
($66,617 - $42,299)
Net price
average 2013-14
(from NCES) for beginning undergrads receiving any financial
aid: $22,696
(15th)
By income
(2014-15): $0 - $30,000: $7733 (14th)
/ $30,001 – $48,000: $8083 (13th) /
$48,001 – $75,000: $13,651 (17th)
/ $75,001 – $110,000: $18,466 (5th)
By income
(2013-14): $0 - $30,000: $8948 (19th)
/ $30,001 – $48,000: $8300 (15th) /
$48,001 – $75,000: $13,995 (20th)
/
$75,001 – $110,000: $20,987 (16th)
No full-ride
provision
for students whose parents make less than $60,000/yr
(unlike other Ivies) but
free tuition and a no-loan financial aid package for
students whose parents earn less than $100,000/yr.
Students from families earning $100,000 to $200,000 have
a loan as part of their financial aid package, limited
to $2,500 to $5,500 annually. (This change was
instituted in Fall 2012; from Fall 2008 to Spring 2012
loans were not part of any financial aid package.)
Debt at Graduation (incl. rank among the
GCR top 133) and Default Rates
Average student debt at graduation
C2014: $17,171 (12th
lowest) / C2015: $19,135 (21st
lowest)
Percentage of graduates with debt:
C2014: 46%
(59th
lowest, 6-way tie) / C2015: 43%
(51st
lowest, 9-way tie)
Student loan default rate
2010: 2.4% / 2011: 1.4% / 2012: 1.7% / 2013:
.9% [4-yr avg.: 1.6%; 3-yr avg: 1.333%]
Graduation Rates, Student Enrollment, Student/Faculty
Ratio, Endowment
1st-year retention rate
(2014-15): 97.2%
/ (2015-16) 97.5% (13th,
tie
in GCR Top 133)
4- & 6-year grad rate
(began Fall
2009): 88%/95% / (began Fall 2010):
88.14% (13th) / 96.57% (5th)
Entering class size:
C2020: 1,121 (C2019:
1,112; C2018: 1,152)
Student pop.: (Fall 2016) 6,409
(4,310 undergrad) / (Fall 2015) 6,350
(4,307 undergrad)
Student to faculty ratio:
(2016-17)
7.44 to 1
(16th)
Endowment
(2016):
$4.47 billion (21st
in US, 24th in the world; in the US 17th
per student [undergrad + grad] and 16th
per undergrad-only)
African American Representation as a
Measure of Diversity
Average number
(and %) per class over 4 undergrad classes, *no
TOMR
(Fall 2016):
73*/1058 (6.93%; 20th in GCR)
Number, incl. those of TOMR:*
C2020: 80*; C2019: 74*; C2018: 84*;
C2017: 73*; C2016: 75* (87)
*Relative
to the Common Data Set figures, online class
profiles for the past few years (https://admissions.dartmouth.edu/facts-advice/facts/class-profile)
inflate African-American representation as 8% and
deflate multi-racial representation as 2-3%. CDS
figures average 7% and 5% respectively.
Earning Potential
PayScale Salary 2016-17:
Early career (0-5 years of employment):
$60,800; Mid-career (10+ years):
$119,000 (13th, 4-way tie)
World Rankings
The
Times Higher Education World University Rankings
(UK) 2016-17: 82t
The Times Higher Education World
Reputation Rankings (UK) 2016:
101+ [unranked in top 100]
QS World University Rankings
(UK) 2016/17: 158
US News Best Global Universities Rankings
2017: 198t
Academic Ranking of World Universities
(Shanghai) 2016: 201-300
Center for World University Rankings
(Saudi Arabia) 2016: 50
Composite Score: 840+
(averages 140th+ in the world)
FIRE Speech Code Rating (Green:
protects; Yellow: may restrict;
Red: clearly restricts)
Dartmouth
College has been given the speech code rating
Yellow. Yellow light colleges and universities are
those institutions with at least one ambiguous
policy that too easily encourages administrative
abuse and arbitrary application. Read more
here.
12.
Rice University,
Houston, TX
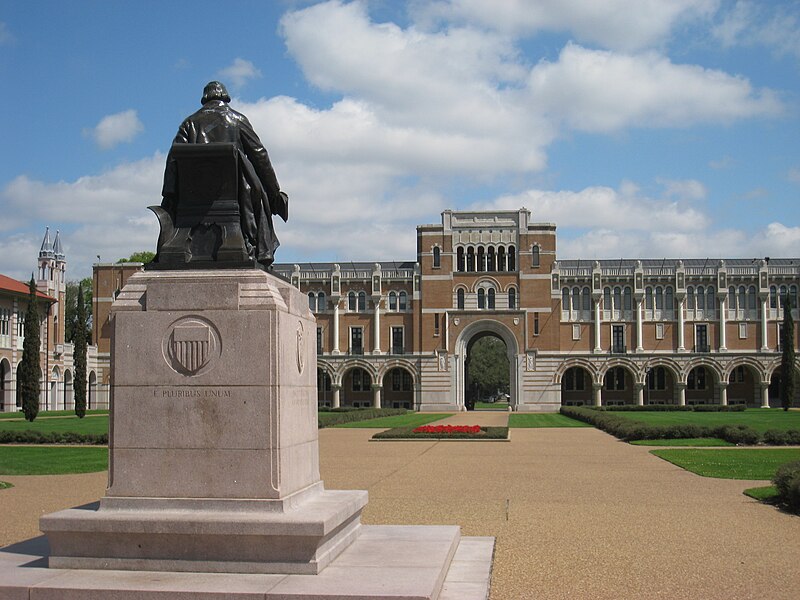
"Rice University - Rice statue with Lovett
Hall" by Daderot - Own work. Licensed under Public Domain
via Wikimedia Commons -
https://commons.wikimedia.org/wiki/File:Rice_University_-_Rice_statue_with_Lovett_Hall.JPG#/media/File:Rice_University_-_Rice_statue_with_Lovett_Hall.JPG
Rankings:
US News (NU) 15t +
College Choice (NU) 13 × 2 = 62; plus…
Forbes 30
WSJ/THE
18
Money 4
College Factual
30
College Raptor
26
Kiplinger
17
Niche
6
PayScale ROI 21
Total, with unranked or worst (outlier) score
dropped, then full score: 178
(208)
Rice University is
our no. 2 Southern school, after Duke. Its best rankings are
fourth (Money, up from last year's fourteenth)
and sixth (Niche, down slightly from last
year's fifth); its middle rankings are
thirteenth (College Choice, national universities
only), a 4-way tie for
fifteenth (US News, national universities only; last
year eighteenth, no tie), seventeen (Kiplinger,
down from 2016's and 2015's seventh), and eighteenth
(Wall St. Journal/Times Higher Education); its worst
rankings are twenty-first (PayScale's
Return on Investment, down from last year's tenth),
twenty-sixth (College Raptor, down slightly from
last year's twenty-second) and twice thirtieth (Forbes,
up slightly from last year's thirty-second; and USA Today's
College Factual, down slightly from last year's
twenty-ninth). US News also ranks Rice #5 (tie) in
Best Undergraduate Teaching among National Universities. In the GCR composite
world ranking list it comes in only at
eighty-eighth-plus.
In terms of
affordability for the past several years Rice has
averaged twenty-eighth in net price when different
income levels are factored in and twenty-ninth when they are
not. Rice's average
student loan at graduation
for that portion of the Class of 2015 taking out any loans
was a surprisingly bad seventy-second among the GCR
top 139 schools; however, the percentage of students graduating
with debt was the thirteenth lowest (tie). Rice has a no-loan financial
aid package for students whose parents earn less than
$80,000/yr. For families with incomes
above $80,000, Rice awards a $2,500 subsidized loan,
capping total loans for four years at about $10,000 for
students with financial need.
Rice's best ratings are its student-to-faculty ratio (5.6 to 1;
fifth), standardized test scores (for the Class of
2019 4-way ties for eleventh and thirteenth for the SAT
without and with the Writing score; a 5-way tie for fourth
in ACT score), and endowment per student ratio
(fourteenth). Rice's weakest ratings are its selectivity
(or desirability) index (thirty-third), yield rate
(35.2%, fifty-third), and four-year graduation rate
(83%, fifty-fifth). According to FIRE, Rice also
has “at least one [speech code] policy that both clearly and
substantially restricts freedom of speech.”
Based on political donations of the people who work there,
Rice University is the 363rd
most liberal university out of 446 (6.5 Liberal;
CrowdPac). This is the
seventy-sixth most liberal school among the 84
schools of the GCR Top 133 that Crowdpac examines.
Test scores of enrolled students
Fall
2016 (C2020):
Mid-50%
(25th
-75th percentile):
SAT
CR 690-770, M 720-800, W 680-770,
Essay 8-10; ACT 32-35
SAT
Average: CR+M:
1490 (avg. 745), ranked 7th +
CR+M+W: 2215
(avg. 738.3), ranked 6th + (tie)
ACT
composite average:
33.5, ranked
2nd + (8-way tie)
Percent
submitted SAT/ACT scores: 66%/64%
Fall
2015 (C2019):
Mid-50%
(25th
-75th percentile): SAT CR 680-760, M 710-800, W 680-770; ACT
32-35
SAT Average: CR+M: 1475
(avg. 737.5), ranked 11th (4-way tie)
CR+M+W: 2200
(avg. 733.3), ranked 13th (4-way tie)
ACT composite average: 33.5, ranked
4th (5-way tie)
Percent
submitted SAT/ACT scores:
72%/58% (2014: 77%/51%; 2013: 80%/53%)
Selectivity
Acceptance rate:
Fall 2012:
16.71%
/ 2013:
16.74%
/ 2014:
15.10% /
2015:
15.96%
(25th) /
2016: 15.27%
(26th)
Yield
rate (of accepted students who enroll) Fall 2014:
35.45% / 2015:
33.82%
(61st) / 2016: 35.22% (53rd)
Selectivity index
(acceptance ÷ yield: the lower the score, the more
desirable):
Fall 2015: .4719 (31st) / 2016: .4336 (33rd)
Net Price
(total expenses – grant/scholarship
aid)
Net price
average 2016-17 for beginning
undergrads…: $24,915
(22nd +) (total costs
$62,168 - average need-based scholarship $37,253); and
for all undergrads: $25,396 (19th +)($62,168
- $36,772)
Net price
average
2015-16 (from CDS) for beginning undergrads…: $23,835
(22nd) (total costs
$60,403 - average need-based scholarship $36,568); and
for all undergrads: $24,378 (21st)
($60,403 - $36,025)
Net price
average 2014-15
(from NCES) for beginning undergrads receiving any financial
aid: $24,612
(31st)
Net price
average
2014-15 (from CDS) for beginning undergrads…: $25,231
(39th) (total costs $58,466 - average
need-based scholarship $33,235); and for all undergrads:
$23,512 (17th) ($58,466 - $34,954)
Net price
average 2013-14
(from NCES) for beginning undergrads receiving any financial
aid: $24,812
(28th)
By income
(2014-15): $0 - $30,000: $9309 (23rd)
/ $30,001 – $48,000: $8239 (16th) / $48,001 –
$75,000: $12,137 (11th) /
$75,001 – $110,000: $24,884 (33rd)
By income
(2013-14): $0 - $30,000: $10,768 (32nd)
/ $30,001 – $48,000: $10,383 (26th) / $48,001
– $75,000: $15,837 (27th) /
$75,001 – $110,000: $26,983 (51st)
No full-ride provision but it does have a
no-loan financial aid policy:
“Rice will not award loans to students whose family
total income is below $80,000. The student's
financial need will be met through a combination of grants,
work study, merit aid (if qualified) and institutional
funds. For families with incomes above $80,000,
Rice will award a $2,500 subsidized loan, grants, work
study, merit aid (if qualified) and institutional funds to
cover 100% of the student's demonstrated institutional
need.” For students with financial need Rice caps total
loans for four years of college at about
$10,000.
Debt at Graduation (incl. rank among the GCR
top 133) and Default Rates
Average student debt at graduation
C2014: $22,241 (50th
lowest) / C2015: $25,528 (72nd
lowest)
Percentage of
graduates with debt:
C2014: 29% (9th
lowest) / C2015: 29%
(13th
lowest, tie)
Student loan default rate
2010: 2.9% / 2011: 1.3% / 2012: 1.7% / 2013: .3%
[4-yr avg.: 1.55%; 3-yr avg: 1.1%]
Graduation Rates, Student Enrollment,
Student/Faculty Ratio, Endowment
1st-year retention rate (2014-15):
96% (11-way
tie for 15th) / (2015-16) 96% (11-way
tie for 31st
in GCR Top 133)
4- & 6-year grad rate
(began Fall 2009): 80.05% (67th)
/ 90.53%
(45th) / (began Fall 2010): 82.94% (55th)
/ 93.11% (27th)
Entering class size:
C2020: 981 (C2019:
969; C2018: 949)
Student pop.: (Fall 2016) 6,855
(3,893 undergrad) / (Fall 2015) 6,719 (3,910 undergrad)
Student to faculty ratio:
(2016-17)
5.62 to 1
(5th)
Endowment
(2016):
$5.324 billion (19th
in the US,* 22nd
in the world; in the US 14th
per student, 7th
per undergrad)
African American Representation as a Measure
of Diversity
Average number
(and %) per class over 4 undergrad classes, *no TOMR
(Fall 2016): 67*/970 (6.91%; 21st
in GCR)
Number, excl. those of TOMR: C2020: 69*; C2019: 62*; C2018: 80*;
C2017: 54*; C2016: 64*
Earning Potential
PayScale Salary 2016-17:
Early career (0-5 years of employment):
$62,300; Mid-career (10+ years):
$113,000 (tied for 24th)
World Rankings
The
Times Higher Education World University Rankings
(UK) 2016-17: 87
The Times Higher Education World
Reputation Rankings (UK) 2016:
101+ [unranked in top 100]
QS World University Rankings
(UK) 2016/17: 90
US News Best Global Universities Rankings
2017: 61
Academic Ranking of World Universities
(Shanghai) 2016: 72t
Center for World University Rankings
(Saudi Arabia) 2016: 114
Composite Score: 525+
(averages 88th+ in the world)
FIRE Speech Code Rating (Green:
protects; Yellow: may
restrict;
Red: clearly restricts)
Rice
University has been given the
speech code rating Red. A red
light university has at least
one policy that both clearly and
substantially restricts freedom
of speech. Read more
here.
13.
Amherst College,
Amherst, MA

"Amherst College Main Quad" by David Emmerman -
PicasaWeb. Licensed under CC BY 3.0 via Wikimedia Commons -
https://commons.wikimedia.org/wiki/File:Amherst_College_Main_Quad.jpg#/media/File:Amherst_College_Main_Quad.jpg
Rankings:
US News (LA) 2 +
College Choice (LA) 1 × 2 = 6+30LA = 36;
Forbes 12
WSJ/THE
23
Money 7
College Factual
6
College Raptor
13
Kiplinger
14
Niche
28
PayScale ROI -
Total, with unranked or worst (outlier) score dropped, then
full score: 139
(-)
Amherst College is the
first liberal arts college to make our list of top universities
and colleges. Its best rankings are understandably in lists that
exclude national universities with graduate school programs:
first in College Choice and
second
in US News (for the latter, same as last year). In the
other lists, its best ratings are
sixth (USA Today's College Factual, up slightly
from last year's seventh), seventh (Money, up from
last year's tie for ninth), twelfth (Forbes, down
from last year's ninth), thirteenth (College Raptor,
up slightly from last year's fourteenth), and fourteenth
(Kiplinger, up from 2016's twentieth and down from 2015's
eleventh). Its lowest ratings are
twenty-third (Wall St. Journal/Times Higher Education),
and twenty-eighth (Niche, up from 2016's and
2015's thirty-fourth). PayScale's Return on Investment
did not give it a rating this year (presumably for insufficient
information), though last year it had Amherst ninety-eighth. On
the basis of aggregate score minus the single lowest or
unregistered score Amherst would be in a tie with Duke for
eighth nationally. One could make a reasonable case of ranking
Amherst tenth, ahead of Brown, Dartmouth, and Rice. US News
also ranks Amherst #13 (4-way tie) in
Best Undergraduate Teaching among National Liberal Arts Colleges.
In terms of affordability for the past several years Amherst has
averaged an impressive eighth in net price when different
income levels are factored in and fourth when they are
not. Amherst's average student loan at graduation
for that portion of the Class of 2015 taking out any loans was
seventh among the GCR top 133 schools; the percentage
of students graduating with debt was the eighth
lowest. Amherst has a no-loan financial aid package
for all students who receive financial aid. For some
low-income students there will be
no parental contribution but Amherst does not
state a cut-off figure. Other
rankings categories range from fifteenth to twenty-second.
Relative to its overall
rank, Amherst performs best in African-American student
representation (second in the GCR top 133; 1.75% more than
third-place Duke and the highest percentage among the GCR top 66)
and endowment per undergrad (eleventh among all schools).
It performs rank-wise worst in average mid-career salary
according to PayScale (eight-way tie for seventy-third); after
this the lowest rankings are in absolute endowment
(fortieth among all US schools), yield rate (thirty-ninth
in the GCR; 40.6%), first-year retention rate (a ten-way
tie for thirty-second in the GCR but still 96%), and
four-year graduation rate (thirty-first; 86.1%). Other
rankings categories range from fifteenth to twenty-second.
Unfortunately Amherst
occupies
an extreme place in sexual and racial politics, even in
relation to the usual extremes that persist in the nation’s top
colleges and universities, as these links make clear (go
here,
here,
here, and
here).
Based on political donations of the people who work there,
Amherst College is the 37th
most liberal university out of 446 (8.7 Liberal;
CrowdPac). This
is the fifth most liberal school among the 84 schools of
the GCR Top 133 that Crowdpac examines.
Test scores of enrolled students
Fall 2016 (C2020):
Mid-50%
(25th
-75th percentile):
CR 680-780, M 680-780, W 680-780;
ACT 31-34
SAT
Average: CR+M:
1460 (avg. 730), ranked 11th +
CR+M+W: 2190
(avg. 730), ranked 9th + (tie)
ACT
composite average:
32.5, ranked 10th (8-way tie)
Percent
submitted SAT/ACT scores: 52%/51%
Fall 2015 (C2019):
Mid-50%
(25th
-75th percentile): CR 680-780, M 680-780,
W 680-770; ACT 31-34
SAT Average: CR+M:
1460 (avg. 730), ranked 17th
(tie)
CR+M+W: 2185 (avg. 728.3), ranked 18th
ACT composite average: 32.5,
ranked 15th (8-way tie)
Percent
submitted SAT/ACT scores: 53%/49% (2014: 58%/45%; 2013:
63%/41%)
Selectivity
Acceptance rate: Fall 2012:
12.96% / 2013: 14.28%
/ 2014:
13.84% / 2015:
14.12%
(20th) /
2016 (C2020):
13.81% (22nd
in the GCR Top 133)
Yield rate
(of accepted students who enroll) Fall 2014: 39.98% / 2015:
39.42% (44th)/ 2016:
40.57% (39th
in the GCR Top 133)
Selectivity index
(acceptance ÷ yield: the lower the score, the more desirable):
2015: .3582 (25th) / 2016: .3404 (28th)
Net Price
(total expenses – grant/scholarship
aid)
Net price average
2016-17 for beginning undergrads…:
$19,173 (2nd +) (total costs
$70,686 - average need-based scholarship $51,513); and for all
undergrads: $20,306 (2nd +)
($70,686 - $50,380)
Net price
average 2015-16 for beginning undergrads…:
$18,758 (7th) (total costs
$68,272 - average need-based scholarship $49,514); and for
all undergrads: $19,138 (3rd)
($68,272 - $49,134).
Net price
average 2014-15
(from NCES) for beginning undergrads receiving any financial
aid: $18,561 (4th)
Net price
average
2014-15
(from CDS) for beginning undergrads…:
$17,601 (3rd) (total costs
$65,706 - average need-based scholarship $48,105); and for
all undergrads: $18,463 (2nd)
($65,706 - $47,243)
Net price
average 2013-14
(from NCES) for beginning undergrads receiving any financial
aid: $16,387 (2nd)
By income
(2014-15): $0 - $30,000: $5653 (6th) /
$30,001 – $48,000: $5546 (5th) / $48,001 –
$75,000: $14,259
(22nd) /
$75,001 – $110,000: $21,017 (14th)
By income
(2013-14): $0 - $30,000: $5400 (10th) /
$30,001 – $48,000: $6540 (9th) / $48,001 –
$75,000: $12,459 (16th) /
$75,001 – $110,000: $22,106 (18th)
No provision for eliminating parental
contribution for low-income families but there is a no-loan
financial aid policy
for all students who receive financial aid.
Debt at Graduation (incl. rank among the GCR top
133) and Default Rates
Average student debt at graduation
C2014: $14,490 (6th lowest) / C2015:
$15,756 (7th lowest)
Percentage of
graduates with debt:
C2014: 31% (11th lowest,
4-way tie) / C2015: 25%
(8th
lowest)
Student loan default rate
2010: 4.5% / 2011: 4.5% / 2012: 1.5% / 2013: 2.4%
[4-yr avg.:
3.225%; 3-yr avg: 2.8%]
Graduation Rates, Student Enrollment, Student/Faculty Ratio,
Endowment
1st-year retention rate
(2014-15): 97.7% / (2015-16) 96% (32nd,
10-way tie)
4- & 6-year grad rate
(began Fall 2009):
88%/95% / (began Fall 2010): 86.09% (31st)
/ 93.46% (22nd)
Entering class size:
C2020: 471 (C2019:
477; C2018:
469)
Student pop.: (Fall 2016) 1,849
(all undergrad) / (Fall 2015) 1,795 (all undergrad)
Student to faculty ratio:
(2016-17)
7.82 to 1
(19th)
Endowment
(2016):
$2.03 billion (only 40th
in the US, tied for 47th
or 48th
in the world; but in the US 8th
per student, 11th
per undergrad-only)
African American Representation as a Measure of
Diversity
Average number
(and %) per class over 4 undergrad classes, *no TOMR
(Fall 2015): 53.5*/462 (11.57%) (2nd)
Number, excl. those of TOMR:
C2020: 53*; C2019: 50*; C2018:
59*; C2017:
57*; C2016:
48*
Earning Potential
PayScale Salary 2016-17:
For All Alumni (insufficient info for Bachelor's Only): Early
career (0-5 years of employment):
$54,500; Mid-career (10+ years): $103,000 (8-way
tie for 73rd)
World Rankings
The
Times Higher Education World University Rankings (UK)
2016-17: [unranked in top 800]
The Times Higher Education World
Reputation Rankings (UK) 2016:
[unranked in top 100]
QS World University Rankings
(UK) 2015/16: [unranked in top 701+]
US News Best Global Universities Rankings
2016: [unranked in top 750]
Academic Ranking of World Universities
(Shanghai) 2015: [unranked in top 500]
Center for World University Rankings
(Saudi Arabia) 2015: [unranked in top 1000]
Composite Score: [unranked]
FIRE Speech Code Rating (Green:
protects; Yellow: may
restrict;
Red: clearly restricts)
Amherst
College has been given the speech code
rating Yellow. Yellow light colleges and
universities are those institutions with
at least one ambiguous policy that too
easily encourages administrative abuse
and arbitrary application. Read more
here.
“Campus
Pride” Index
Rating:
4 out of 5 stars
This is an
overall indicator of an institution’s
zealous promotion of an “LGBTQ” agenda
to the detriment of any who have moral
qualms about such an agenda, through
coercive indoctrination, active
“diversity” recruitment, special
resourcing, sanctions, and slander of
those who support a male-female
foundation for sexual unions as
“hateful, ignorant, homophobic bigots”
on a par with racists. For
moderate-to-conservative students it
represents the greatest threat to their
freedom of speech and association, faith
and religious liberty, and due process
at this institution. Applicants may
still thrive in this oppressive
environment, off-set by association with
like-minded persons, but should be aware
of the risks before applying.
14.
Vanderbilt University,
Nashville, TN
"VanderbiltPeabodyLibrary" by Dansan4444 - Own
work. Licensed under CC BY-SA 3.0 via Wikimedia Commons -
https://commons.wikimedia.org/wiki/File:VanderbiltPeabodyLibrary.JPG#/media/File:VanderbiltPeabodyLibrary.JPG
Rankings:
US News (NU) 15t + College
Choice (NU) 12 × 2 = 54; plus…
Forbes 45
WSJ/THE
21
Money 27
College Factual 17
College Raptor
23
Kiplinger
8
Niche 14
PayScale ROI 54
Total, with unranked or worst (outlier) score dropped, then
full score: 209
(263)
Vanderbilt University is our third-place
Southern school behind Duke and Rice. It has one top-ten ranking
(eighth, Kiplinger; compare to 2016's sixth and
2015's fifteenth); another four between eleventh and twentieth (twelfth,
College Choice for national universities only; fourteenth,
Niche, up slightly from 2016's seventeenth and down slightly
from 2015's tenth; tied for fifteenth,
US News for national universities only, same rank as
last year; and
seventeenth, USA Today's College Factual, down
slightly from last year's sixteenth); three more between
twenty-first and thirtieth (twenty-first, Wall St.
Journal/Times Higher Education; twenty-third,
College Raptor, down slightly from last year's twentieth;
and twenty-seventh, Money, down slightly from last
year's twenty-fourth tied); and finally two as far down as
forty-fifth (Forbes, up slightly from last year's
forty-seventh) and fifty-fourth (PayScale's
Return on Investment, down from last year's
thirty-ninth). US News also ranks Vanderbilt #10 (tie) in
Best Undergraduate Teaching among National Universities. Its composite world rank is
one-hundredth-first-plus, brought down by a poor QS World
University Ranking (203) and a non-showing in the top 100
of the Times Higher Education World Reputation
Ranking. For the other four world rankings lists it averaged
seventy-sixth (108 in the Times Higher Education
World University Ranking).
In terms of affordability for the past several years Vanderbilt
has averaged a respectable twelfth in net price when
different income levels are factored in and sixteenth
when they are not. Vanderbilt's average student loan at
graduation
for that portion of the Class of 2015 taking out any loans was
twenty-second among the GCR top 133 schools; the
percentage of students graduating with debt was the
third lowest (4-way tie). Vanderbilt has a no-loan
financial aid package
for all students who receive financial aid; but
no elimination of parental contribution for
low-income students.
Relative to its overall
rank, Vanderbilt performs best in standardized test scores
of its entering class (for the C2019 in SAT scores fourth [CR+M]
and tied for fifth [CR+M+W]; in ACT composite score a 5-way tie
for fourth) and in African-American representation (9.2%,
fifth in the 2016-17 GCR). The only areas where
Vanderbilt falls considerably short of its overall rank are in
its mid-career average salary, where it ranks only
seventy-first, and its endowment per student, where
it ranks fifty-first (but twenty-third in total endowment
amount [$3.8 billion]). Otherwise, its lowest rankings are in
its 6-year graduation rate (twenty-ninth but still 92.4%), its
yield rate (46%, twenty-sixth), and its 4-year grad rate
(twenty-first but still 87.4%).
Events at Vanderbilt
have left orthodox Christians and politically
moderate-to-conservative persons wondering whether Vanderbilt is
intolerant of their views and a denier of free speech and
academic freedom. Vanderbilt
kicks off campus any Christian group that requires leaders
to adhere to the group’s view of orthodoxy and orthopraxy (if
you guessed that the “GLBTQI” push for forced acceptance is at
the root of the controversy, you guessed right; go also
here,
here, and
here). Imagine the absurdity of requiring College Democrats
to have Republican leaders or a campus Muslim group to have
Christian leaders. Professor of law
Carol Swain (who happens to be African-American and orthodox
Christian) was viciously attacked by students for her critique
of Islam, though the real impetus for much of the attack on
Swain appears to be payback for her views on a male-female
foundation for marriage and her defense of Christian groups (go
also
here). The administration was of little help.
The Chancellor’s response was a case of double-(or
triple-)speak, at once attacking Swain, defending freedom of
speech and “the expression of unpopular and offensive views,”
and warning against speech “whose … effect is to discriminate,
stigmatize, … offend, foment hatred…, or cause harm” which “has
no place in this university.” So Vanderbilt protects offensive
speech and yet will not tolerate speech that offends? Of course,
the most threatened, offended, stigmatized, and discriminated
groups on campus are the orthodox Christians and those holding
politically moderate-to-conservative views. Dr. Swain left
Vanderbilt this year.
Based on political donations of the people who work there,
Vanderbilt University is surprisingly only the 355th
most liberal university out of 446 (6.6 Liberal;
CrowdPac). This is the
seventy-fourth most liberal
school among the 84 schools of the GCR Top 133 that
Crowdpac examines.
|
#/media/File:College_Hall_and_Ben_Franklin_Statue.jpg)